Monday, June 30, 2014

World Congress of Environmental and Resource Economics


I am, like almost 1200 other participants, at the WCERE in Istanbul. Yesterday there was an interesting panel session on climate change with Jeffrey Sachs, Ottmar Edenhofer (who is apparently meeting the Pope today), Marianne Fay from the World Bank,  Laurence Tubiana - the new French climate change ambassador - and Carlo Carraro as chair. All the participants agreed that the new framework for climate change policy that will be established at Paris next year must make a break from previous agreements and pledges in consisting primarily of designing long-term transformation pathways rather than primarily short-term targets. Obviously, short-term steps will still be needed. The thinking behind this was best expressed by Marianne Fay. She showed a slide with a picture of the Freedom Tower in New York and a small cottage side by side. She asked: "If you wanted to build this tower, would the house on the left be a reasonable first step?" Similarly, we could ask whether shifting to natural gas is a reasonable first step to decarbonizing the economy. A long-term perspective is needed. Jeffrey Sachs made a point that spot carbon markets aren't an appropriate tool for long-term climate policy. The short-term price keeps fluctuating and there is no long-term futures market. Instead a predictably rising carbon tax is needed. Technology policies are also needed to complement the carbon price. The consensus is that this is where we should head.

Thursday, June 26, 2014

Canberra is the Best Place to Live in the World According to the OECD

Australia is the best country and the ACT is the best region in Australia. I checked the OECD website, and giving equal weight to each of the criteria the OECD ranks, the ACT is the highest scoring region in the world. Of course, that is not how most Australians see it. I met an Australian woman at JFK airport last week while waiting to take the train and she asked me where I lived. When I answered: "Canberra", she said: "Why would you do that to yourself?"


Wednesday, June 25, 2014

Follow Up on "Energy and Economic Growth: The Stylized Facts" at Econbrowser

James Hamilton has a new post on Econbrowser based partly on our paper Energy and Economic Growth: The Stylized Facts which I recently presented at the IAEE meeting in New York. I'd add that oil use has been flat in recent years but that was compensated for by increases in the use of natural gas, coal, and renewables. So, recent data don't substantially deviate from our stylized fact.


Today, I arrived at A Toxa, an island in Galicia, in the northwest of Spain. It is really beautiful here. Tomorrow the 6th Atlantic Workshop on Energy and Environmental Economics
starts here. I am giving a presentation in the final session tomorrow on our paper on modeling the emissions-income relationship using long-run growth rates.

Thursday, June 19, 2014

High-Ranked Social Science Journal Articles Can Be Identified from Early Citation Information

I have posted a new bibliometric working paper , which investigates how well we can predict future cumulative citations from the first citations received by a paper in the disciplines of economics and political science.

It is usually assumed that citations accumulate too slowly in social sciences apart from psychology to be useful for short-term research assessment. For this reason, the Australian Government’s Excellence in Research for Australia (ERA) exercise, which attempts to assess the research quality of universities in the previous 5 years, uses peer review in social science disciplines apart from psychology for this reason but uses citation analysis for psychology and all natural sciences. This peer review process seems to me to be a wasteful duplication of effort to review research outputs that have already passed through a peer review process once.

I show that, surprisingly, citations received by journal articles in the social sciences in the first one to two years after publication are strongly predictive for citations received in future years. By contrast, I show that journal impact factors are mostly useful in the year of publication and their contribution to predicting citations declines rapidly thereafter.

If it is actually possible to predict citations fairly reliably in social science disciplines, then it should also be easy to predict them in the natural sciences. This means that it should be possible to expand bibliometric analysis in research evaluation exercises to all disciplines apart from the humanities and arts. It also means that we should pay attention to the early citations received by papers when we evaluate individual academics for hiring and promotion. Impact factors are reflective of journal selectivity, which we frequently do not have easily available data on. But they only explain about 16-17% of the variation in rankings of papers six years later conditional on the citations already received in the year of publication. The latter explain 13-14% of the variation. But at the end of the year following publication, accumulated citations explain 52-53% of the variation in cumulative citations after 6 years and 73% at the end of the second year after publication.

These models could be improved by adding information on the characteristics of the articles themselves and their authors, but that was much too time consuming to do for the almost 12,000 articles in my sample.

I have submitted a copy of my paper to the HEFCE inquiry on the use of metrics in research assessment.

Energy and Economic Growth: The Animated GIF

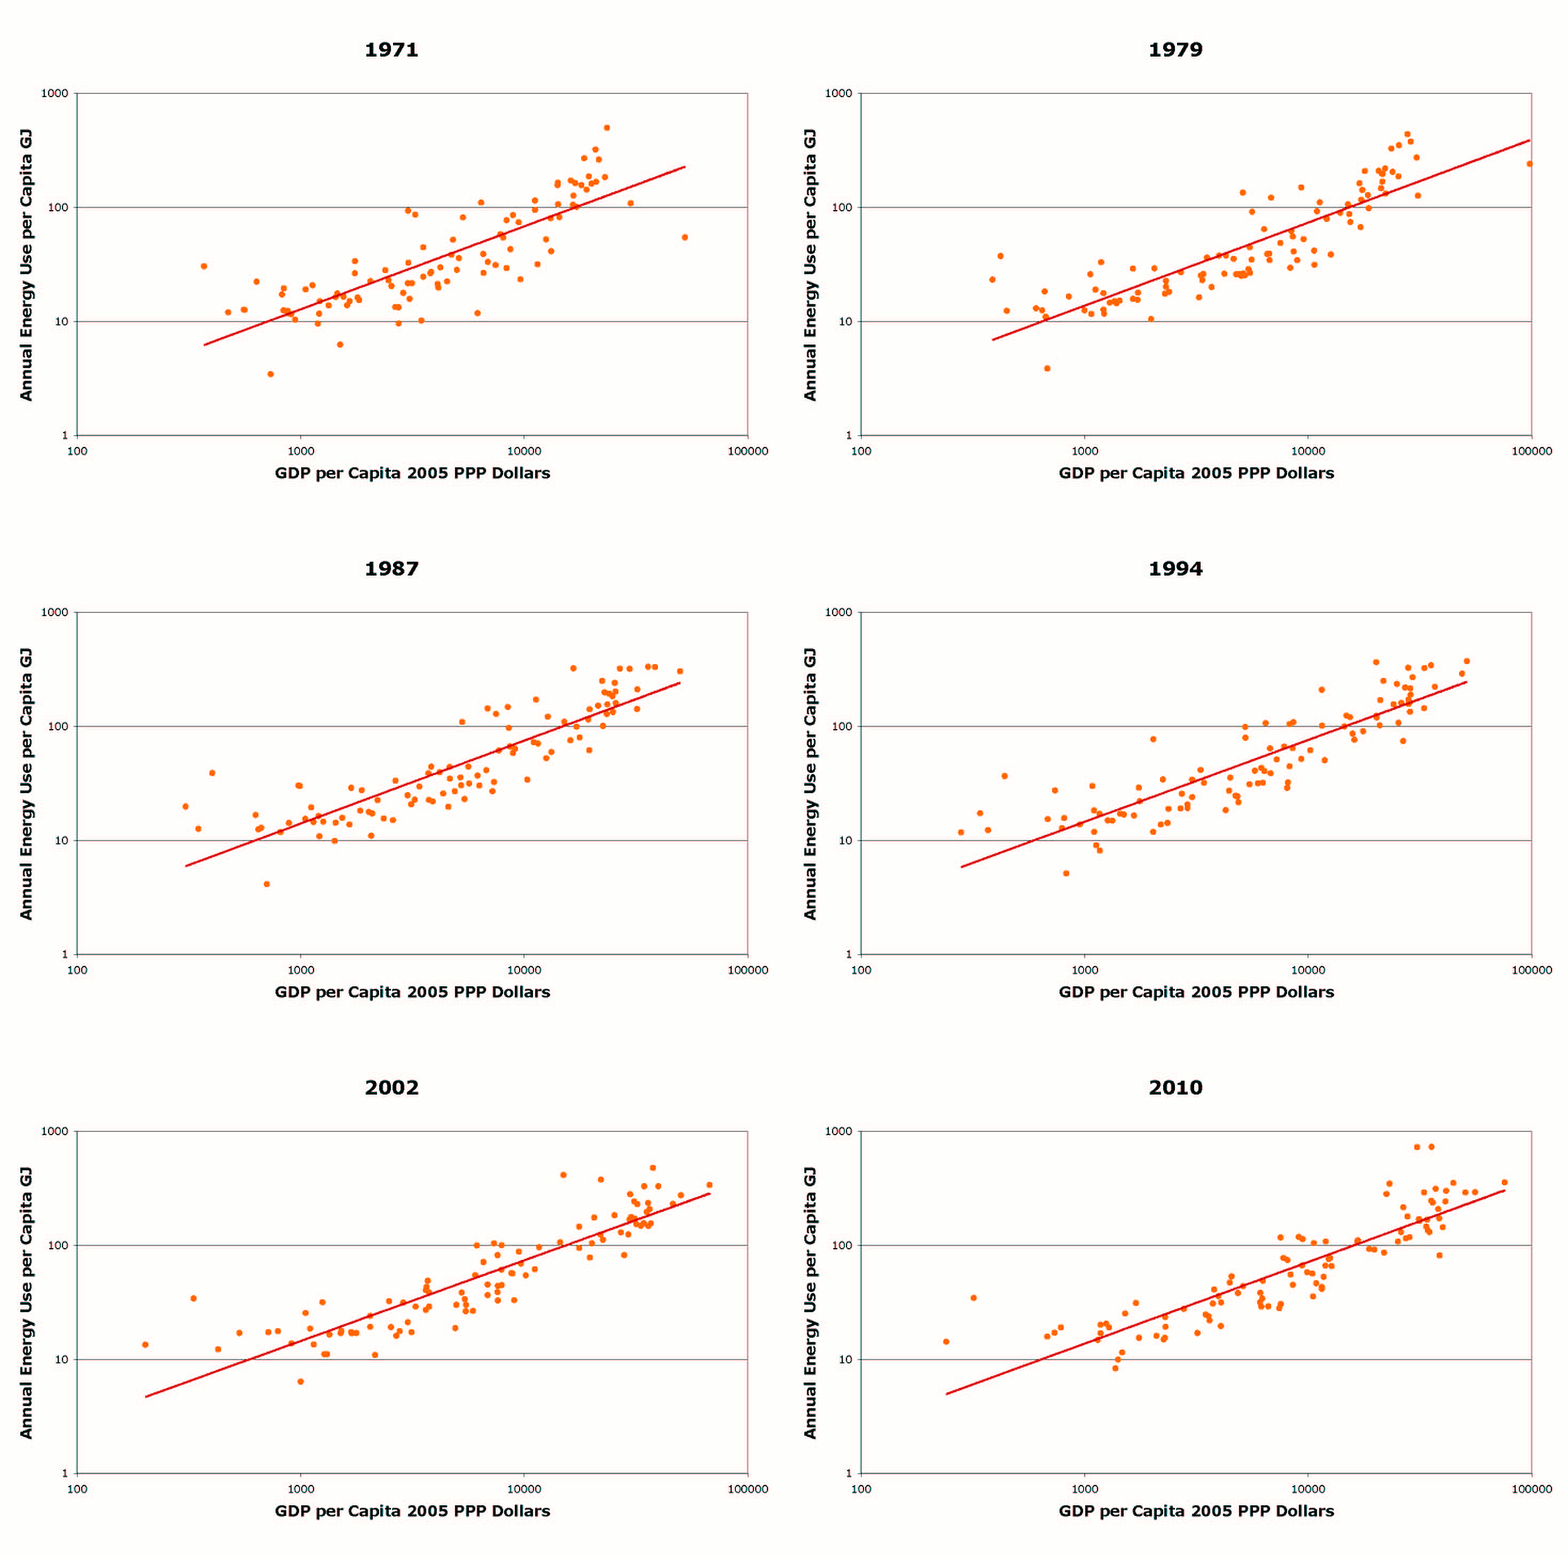
It seems that everyone loves the animation of energy use per capita and GDP per capita that I am showing as part of my presentations on Energy and Economic Growth: The Stylized Facts. So, at James Hamilton's suggestion and with Zsuzsanna's help I have made an animated GIF of this slide sequence:

The graph is for the 99 countries that have data in both the Penn World Table (7.0) and the IEA Energy Balances. The line is the best fit log-log regression computed by Excel. As you can see the relationship between these two variables has been very stable over the last forty years globally.

Wednesday, June 18, 2014

World Energy Use Increased 2.3% in 2013

The annual BP Statistical Review was just released. It shows that world energy use increased by 2.3% in 2013. According to the IMF, the world economy grew 3% in 2013. World population is growing at about 1.1% p.a. Therefore, there was a 1.2% increase in per capita energy use for a 1.9% increase in GDP per capita - a ratio of 0.63 - which is a little below our stylized fact that energy use tends to increase by 0.7% for a 1% increase in GDP.

Tuesday, June 17, 2014

Environment and Development Economics is 20 Years Old

And there is a special issue to celebrate. You can find the introductory article from the editors here. One of my tasks as a post-doc at University of York was helping my boss, Charles Perrings, with the administrative tasks for the new journal like sending invitation letters to the editorial board members. It's also 20 years since I got my PhD - my defence was in April 1994 - I started the post-doc at York as an "ABD" in September 1993. Time flies!

Right now I'm at the IAEE meeting in New York City, will be going on to the Atlantic Workshop in Spain next week and the World Congresss of Environmental and Resource Economics in Istanbul the following week. Not surprisingly, the main talk here is about shale oil and gas and their implications. Flying over Pennsylvania on Sunday I saw quite a few drilling sites...

Saturday, June 7, 2014

Friday, June 6, 2014

The Environmental Kuznets Curve: A Primer

I've updated my article on the environmental Kuznets curve that appeared in the Encyclopedia of Energy in 2004. The revised version will be available as part of Elsevier's Online Reference Database: Earth Systems and Environmental Sciences. I've also posted a working paper version of the article titled: The Environmental Kuznets Curve: A Primer. Despite all the papers that have been published on the topic in the past ten years, I don't think my main messages have changed much. Increases in income tend to increase emissions per capita but time related and other effects can reduce emissions. On the other hand concentrations of some local pollutants are reduced by income increases. The section on theory is a bit more optimistic than I was in 2004 but I think there is still opportunity to develop a comprehensive theory of how income and emissions evolve. I also write in the conclusions that recently developed econometric methods have also only been applied to analyze a couple of well-known pollutants. Therefore, I expect that in coming years this will continue to be an active area of research interest. The emerging issue of how emissions evolve over the business cycle is also likely to be an area of expanding research.


Thursday, June 5, 2014

Energy and Economic Growth: The Stylized Facts

I contributed an article to the IAEE Energy Forum as part of their report on the New York City conference of IAEE. The topic of our paper that I will present in New York on 16th June is "Energy and Economic Growth: The Stylized Facts". The full paper is available as part of the conference proceedings. This has been a project under development for a while, being the subject of my "foundation seminar" (=inaugural lecture) here at Crawford School. Things progressed further once Zsuzsanna Cserekylei put a consistent dataset together for the 1971-2010 period and did the analysis. Then Mar Rubio contributed historical data and analysis. Anyway, this is the text of our article:

What overall patterns, or stylized facts, characterize the relationship between economic growth and energy use both across countries and over time? Energy economists and economic historians have investigated these issues, but existing research has either looked at how energy use and economic development vary across countries at one point in time or how they evolve over time in individual countries or groups of countries. Researchers have not linked together the cross-sectional and time series behaviors despite their obvious dependence on each other.

We investigate the links between the time and cross-sectional (or income per capita) dimensions using two datasets. One is a dataset for 99 countries from 1971 to 2010 that uses IEA and Penn World Table data. The other comprises historical data for the U.S. and a number of European and Latin American countries that extends back to 1800 for the U.S. and some Northern European countries and to later dates in the 19th and early 20th century for the other countries.

In recent years, economic historians, including one of the authors of this paper, Mar Rubio, have been working to reconstruct the energy history of many countries in Europe and the Americas for the years before the Second World War. Some of the historical data we use was prepared for the recently published Power to the People, authored by Astrid Kander, Paolo Malanima, and Paul Warde and published by Princeton University Press. Mar Rubio collaborated with Kander et al. on the Spanish data for that volume and led a team that developed historical data for Latin America. Though these data are obviously much more uncertain than those for recent years, they can provide insights into the long-run relationship between energy and economic development.

Our key finding from the recent data is that there has been a fairly stable relationship between countries’ GDP per capita measured in purchasing power parity adjusted Dollars and their per capita energy use over the last 40 years. A 1% increase in income per capita across countries is associated with a 0.7% increase in per capita energy use. This implies that energy intensity (energy use/GDP) is lower in richer countries and that on average a 1% increase in income per capita is associated with a 0.3% decrease in energy intensity.

The relationship is also stable in the sense that the average energy use per capita associated with any given level of income per capita has not changed over the four decades. This means that the typical country only managed to reduce its energy intensity by increasing its income per capita. A different way of looking at the same data is to compare countries’ average GDP per capita growth rate from 1971 to 2010 to the rate of change in their energy intensity over the same period. This relationship is shown in Figure 1:


The graph shows that higher rates of economic growth are associated with higher rates of decline in energy intensity. The graph also shows that if a country’s economic growth was zero then not only did its energy intensity not decline, but actually it increased on average.

Figure 1 also indicates that there are many countries where energy intensity rose despite economic growth. Our second main finding is that there was convergence in energy intensity over time and that the countries whose energy intensity rose typically had low energy intensity at the beginning of the period. Countries that were very energy intensive typically saw declines in energy intensity. There is now a tighter relationship between income and energy use than there was forty years ago.

In other words, though there has been some degree of “decoupling” of energy and growth in some formerly energy intensive economies, this has not been the common experience. Rather, there has been a homogenization, with countries increasingly resembling each other, while energy intensity globally has declined, but not by enough to reduce energy use.

This picture is borne out in the historical data too. Figure 2 shows the evolution of energy intensity and income over the last two centuries for four representative countries. Energy intensity appears to have declined the most in the United States, which was the most energy intensive economy in the 19th Century. On the other hand, energy intensity has been fairly stable in Spain, which was a very low energy intensity economy in the 19th Century. These time-paths are superimposed on the global distribution of energy intensity and income in 2010. This shows that in the past the United States was more energy intensive for its income level than any countries are today but that in the last few decades it has ceased to be remarkable in that way. On the other hand, the time paths of Sweden, Brazil, and Spain are mostly within the present day energy intensity distribution.


Our paper in the online proceedings also covers other regularities in the data. Specifically, there is some evidence that the share of energy in costs declines over time. But this “stylized fact” is still more of a prediction than a proven regularity. As is well known, the quality of energy increases over time and with income as countries have transitioned from traditional biomass, to fossil fuels, to primary electricity over time. We also find that the energy/capital ratio, which is an alternative to energy intensity as an indicator of overall energy efficiency, behaves somewhat similarly to energy intensity.

Future theoretical models of the relationship between energy use and economic development will need to take these stylized facts into account and make sure that their predictions match the facts. The stylized facts might also be useful for developing simple business as usual energy use scenarios.

Asia and the Pacific Policy Society

The Asia and the Pacific Policy Society is an academic society set up in association with Crawford School's flagship journal, Asia and the Pacific Policy Studies. Joining the society is free.

Sunday, June 1, 2014

First Issue of JAERE is Out

The first issue of the new Journal of the Association of Environmental and Resource Economics has now been published. A mix of different topics and some big names, though not as many as one might expect for the first issue of a new journal.

The Relationship Between per Capita Energy Use and Income per Capita Has Been Very Stable

First preview of the paper that I will be presenting at the IAEE meeting in New York in a couple of weeks. Using Penn World Table 7 data for GDP per capita and IEA data for energy use, we (me, Zsuzsanna Csereklyei and Mar Rubio) found that the relationship between energy use per capita and income per capita has been very stable from 1971 to 2010 for a group of 99 countries. I've prepared an animation that shows this relationship. Just click through the pages in the pdf to see what happens as countries have grown (or not) over time.

Friday, May 30, 2014

Thursday, May 29, 2014

Elsevier Article Usage Dashboards and Tips for Early Career Researchers

The new article usage dashboards are a nice feature of Elsevier journals. Here is the dashboard for my 2013 article in Energy Economics:

It's interesting to see where our paper is being downloaded. China is in the lead. Obviously there are a lot of downloads in Sweden and Australia as the authors are Swedish and Australian and the data is Swedish. Also, there are a lot of downloads in Turkey, which has a lot of researchers in energy economics.

There is also a link in the Dashboard to a page with lots of useful guides for early career researchers. Some of the advice will also be useful for more senior researchers looking to get greater impact from their publications.

Reforming IPCC Communications

The IPCC is currently discussing whether to change its approach to publications and communications in future years. We (Frank Jotzo and I) were asked about our opinions as former lead authors by the people in the relevant government departments here. It seems to make sense to have more of a continuous reporting model given the capability of the web. Perhaps each chapter could be updated one at a time on an ongoing cycle or even a Wikipedia style format could be adopted. On the other hand, the large septennial assessment reports do generate a big media splash for a few days when they are released, which the continuous communication format would not. If assessment reports are continued, then maybe they should all be released simultaneously, or each Working Group release its report 2 years apart. The 5th assessment report cycle saw WG1 release its report in September 2013 and then WG2 and WG3 released their reports two weeks apart in April 2013, which was somewhat confusing. We also thought that the IPCC plenary should be less prescriptive about the contents of each chapter including sub-sections and what should be in each subsection.

COIN in the UK have released a short report with some more radical suggestions. In particular, they think the IPCC should do human interest stories that are more suitable for most media outlets and use social media more effectively.

Wednesday, May 28, 2014

Australian Energy Intensity Decomposition

This post is based on part of a presentation that I gave yesterday in a short course here in at ANU. Australia has improved its energy intensity over recent decades but the gains have been quite small. My research suggests that adjusted for industrial structure etc. Australia is relatively energy inefficient compared to other developing countries. The following graph removes all these other factors, resulting in a measure of "pure" energy efficiency:


A declining trend implies increasing energy efficiency. I advised Muhammad Shahiduzzaman on his PhD research at the University of Southern Queensland. Subsequently, he published a paper in Energy Policy on decomposing Australian energy intensity. The following graph from the paper shows the effects of structural change at two levels of aggregation on Australian energy intensity:


The shift between the larger sectors helped reduce energy intensity but the shifts between smaller categories of industries tended to increase energy intensity. Real intensity is the residual energy intensity once the structural effects are removed. The Australian Bureau of Resource and Energy Economics has also carried out research on energy intensity trends and decomposition. The following graph shows the decomposition for the transport sector in Petajoules:


The activity effect here is the energy use increase due to increased passenger and tonne kilometres for passenger and freight transport respectively. Structural change - shifts between road, rail, air etc. contributed very little. There was a substantial efficiency improvement but it was outweighed by the large increase in activity resulting in a substantial increase in energy use in the sector. The final graph in this post, shows the decomposition for the residential sector in Australia:

In this decomposition, the activity effect is the increase in energy use due to increased  population. The BREE researchers defined the structural effect as due to larger houses, smaller households etc. I think it is debateable as to whether this should be considered structural change rather than change in the level of activity. In any case the efficiency improvement is of the same order as either the activity or structural effect and so energy use increased here too.

Tuesday, May 27, 2014

Modeling the Emissions-Income Relationship Using Long-Run Growth Rates

We have a working paper out on a new way of modelling the relationship between emissions and GDP per capita, a literature that has been dominated for more than two decades by the environmental Kuznets curve (EKC) approach. I presented an early version of this paper at the AARES conference at Port Macquarie in February. I will also be presenting it at the 6th Atlantic Workshop in A Toxa, Spain in late June and then at the World Congress of Environmental and Resource Economics in Istanbul a few days later.

The paper emerged from our work on Chapter 5 of the recently released Working Group III volume of the IPCC 5th Assessment Report. Reyer Gerlagh, who was one of the coordinating lead authors on my chapter drew up a version of the following graph and asked me if it would be suitable for the section I was writing on economic growth and emissions:


I liked this graph so much that I said we should write a paper about it, which we have now completed. Rather than compare the levels of emissions and GDP per capita as is usually done in the EKC literature, the graph compares the average growth rates of these two variables over a 40 year period (1971-2010). We can see that faster economic growth is associated with faster carbon emissions growth but that there is also a lot of variation around this main trend in the data. The further "southeast" a bubble is, the faster emissions per dollar of GDP (emissions intensity) declined in that country. As you can see China (the big red circle) and the US the big blue circle both had rapid declines in emissions intensity. But emissions intensity also rose in many countries and it is not immediately obvious how it relates to development status.*

One of the nice things about using growth rates rather than levels of variables is that it avoids several econometric problems that have plagued this literature. First and foremost is the issue of unit roots and non-linear functions of unit roots raised by Martin Wagner. Differencing the variables removes that issue, but using long-run growth rates focuses attention on long-run behavior, whereas using first differences would focus on the short-run. Then there is the issue of time effects raised by Vollebergh et al. We think our approach does a good job there too. The constant in a regression of emissions growth rates on income growth rates represents the rate of emissions growth if there were no economic growth. We think this is a good definition of a time effect. The paper discusses further econometric issues.

The other nice thing about using growth rates is that we can test the three main leading approaches to modelling the emissions-income relationship in a single framework:


In this equation all variables are in logs and "hats" (or more elegantly circumflex accents) indicate growth rates. On the lefthand side is the emissions per capita growth rate. As mentioned above the constant, alpha, represents the time effect. G-hat is the growth rate of GDP capita. The estimate of beta(1), therefore, tests the IPAT theory that growth causes increases in impacts. The term beta(2)*G(i) tests the EKC theory. This is because if beta(2) is negative then beyond a certain income level (the "turning point") more growth reduces emissions rather than increases emissions. The other main approach to modelling emissions growth has been the convergence approach, including the Green Solow Model of Brock and Taylor. We test this with the fourth term in the regression, which is the level of emissions intensity in the first year of the sample. If delta is negative, then countries with high initial emissions intensities saw more rapid decline in emissions. We also test for any effect of the level of GDP (gamma*G(i)) and for various other exogenous variables including fossil fuel endowments, legal origin, and climate.

It turns out that for both carbon and sulfur dioxide the effect of growth is very significant and close to a one to one effect. For sulfur there is a significant time effect - emissions fell by about 1.2% a year for a typical country when there was no economic growth. The convergence effect is also highly significant and probably explains a lot of the reduction in emissions intensity in both China and the US. But there is no environmental Kuznets curve effect in the full sample estimates.** While there is a marginally significant coefficient for one dataset, all the turning points are far out of sample and insignificant.

The environmental Kuznets curve has become so iconic that it often appears in introductory environmental economics textbooks. It probably is valid as a stylized fact for urban air pollution concentrations but it's not a good model of emissions of either carbon dioxide or sulfur emissions. We're hoping that the figure of the growth effect above and this one of emissions convergence:

might replace it.

* The blue circles are the developed countries that were members of the OECD in 1990. Orange is "economies in transition"  - Eastern Europe and the former Soviet Union. The other colors are the developing regions in Asia, Latin America, and the Middle East and North Africa.

** When we split the sample into two periods we find a very significant coefficient for sulfur in the second period, but the turning point is at $38k and is not statistically significant.


Saturday, May 24, 2014

Is Piketty's Work Flawed by Computational Errors Too?

The Financial Times claims that, like the work by Reinhart and Rogoff on debt and growth, Piketty's research on changes in inequality over time is also beset by computational errors. Though the theoretical component of Piketty's book has been controversial but as the article says, the critics have still praised the historical research. The biggest differences seem to be in estimates of wealth inequality in Britain in recent decades. The data the FT correspondent provides shows no increase in concentration in wealth in the top 1% and top 10% in the UK in recent decades. That would weaken Piketty's conclusions overall, but it doesn't seem it destroys them. Piketty's response is here.

Friday, May 23, 2014

Unionization in Australian Universities


After seeing that Alison Booth's paper from the Quarterly Journal of Economics was the most downloaded paper from ResearchGate at Crawford this week, I was curious what fraction of employees at Australian universities belonged to the National Tertiary Education Union. Apparently NTEU has 26,000 members. It also seems that there are 113,000 employees in the university sector. On that basis the unionization rate would be only 23%. Of course, quite a lot of those are casuals or PhD students working as lecturer A etc.* But the total number of full-time staff is 86,000. That implies 30%. Also there were 67,933 staff on continuing contracts. If the latter is the real target market for the union then the rate is 38%. Based on this, social custom doesn't work well in the university sector to overcoming free-riding. Let me know if any of my assumptions are wrong as this is the first time I've ever looked at this issue.

* There were 41,730 academics at levels B and above, but the union also represents non-academic staff.

Thursday, May 22, 2014

Regional Kaya Identities

As well as the global Kaya identity, Chapter 5 of the WGIII IPCC report also includes regional Kaya identity graphs:


OECD-90 are the countries that were members of the OECD in 1990 and are considered to be the "developed countries" for the purpose of this study. Economies in Transition are the former Soviet Union and formerly centrally planned Eastern European economies. The remaining countries are the developing world and are split into three geographic regions.

We drew the graph for each region with the same y-axis scale so that the huge differences in growth rates between regions would be more apparent. GDP per capita grew by far more in (developing) Asia than anywhere else and grew least in the Middle East and North Africa. But emissions grew the second most in the latter region mainly because population grew fastest in that region but also because, unlike other regions, energy intensity rose over time. Emissions growth was also quite strong in Latin America because energy intensity did not decline much there. Both these regions had low energy intensity at the beginning of the period. The global pattern in changes in energy intensity reflects convergence across countries in energy intensity.

Tuesday, May 20, 2014

The Global Kaya Identity

Another post on our chapter in the recently released Working Group III IPCC report, Chapter 5. I previously posted on what got left out of the final edition of the Summary for Policymakers and on the key messages from the whole report.

A key feature of our chapter is that we organized it around the idea of the Kaya Identity, which is an extension of the famous IPAT identity to explain changes in carbon emissions:


or in terms of formulae:


Sections of our chapter deal with each of the terms in the identity. It's important to understand that the identity is not really a causal relationship. A 1% increase in GDP per capita might be associated with less than a 1% increase in carbon emissions if energy intensity for example declines as a result of the increase in income. This seems to be the case in fact as our upcoming research will show. Still, it is a useful accounting framework for understanding the factors driving change. If the other terms in the identity are held constant then a 1% increase in any of the right hand side factors increases emissions by 1%.

In the technical summary we use the Kaya identity to decompose the changes in global energy related carbon dioxide emissions for each of the last four decades:


The bars show that reductions in energy intensity have contributed to the slowing in growth in carbon emissions. However, this has been overwhelmed by the increase in population and income per capita. This exercise made me much more aware of how important population growth has been in driving emissions growth over the last 40 years. In the most recent decade, though, income per capita growth became the most important factor and emissions growth accelerated to a record level.

13 Years On Our Book Becomes an E-Book!

The book was published in 2001 but the conference it is based on was held in Boston in 1996! Anyway, the e-book is now online and the introductory chapter is open access.

Thursday, May 1, 2014

Submissions to AJARE Way Up, Acceptance Rate Way Down

Really interesting data from the editors of the Australian Journal of Agricultural and Resource Economics. It's unusual to see time series stretching back 15 years of submissions, acceptances, articles published etc. for a journal. The page budget today is slightly higher than in 1999 but less than what it was in 2000. The number of articles published though actually doubled. But submissions tripled. In the last year half of new submissions have been desk rejected.

Wednesday, April 30, 2014

First Invited Paper Published in Energies Special Issue

I am the editor of a special issue of the open access journal Energies. The special issue is on energy transitions and economic change. I'm happy to announce that the first paper that I invited for the special issue has now already been published. It is by Steve Sorrell and is on the rebound effect.
The first contributed paper has also been published. Others are still in the peer review process and a few we also already rejected.

The model for these special issues is that the editor invites a number of people to contribute papers and there is also a general call for contributions. The journal is publishing papers as they are ready but you can still submit papers up to the 15th July deadline.