David Stern's Blog on Energy, the Environment, Economics, and the Science of Science
Friday, December 31, 2010
iPad Pricing
Apple charges AUD 130 more for the 32GB iPad than for the 16GB iPad. Yet a 16GB flash memory card can be bought for as little as AUD45. The premium in the US is USD 100. Interestingly, the premium for a 64GB iPad relative to a 32GB iPad is also AUD 130/USD 100. The lowest price I found for a 32GB flash drive was AUD 89. It looks like Apple makes much more profit off the higher memory versions than the base model and that this is a form of price discrimination which is enabled by it not being possible to add flash memory oneself to the iPad. I think this can be analyzed as a case of "tying". Apple requires that you buy the extra memory from it, much as the movie theatre bans food apart from that they sell themselves. This would be a good case study or exercise for a microeconomics course.
More on iPad pricing from the Economist.
Thursday, December 30, 2010
Flash Drives vs. Memory Cards
Since writing my previous post about memory devices I tested a class 2 (probably) Sandisk SD card from a digital camera vs. my Lexar flashdrive using the free XBench software. I was using my MacBook Pro for the tests and just plugging the Sandisk card into the SD slot on the laptop. Here are the results. First the flash drive:
And here is the memory card:
Data can be read faster off this flash drive than off the memory card but writing to the memory card is faster than to the flash drive. This greater uniformity of read-write speeds seems to be a feature of memory cards. These speeds seem to be reflected in real world applications. It takes a lot longer to copy files to the flash drive than vice versa. The MacBook's hard drive is mostly faster than either portable device:
Tuesday, December 28, 2010
SD Memory Cards
In the last couple of years I have used a USB flash drive like this:
as my primary computer data storage and I've used the hard drive on my laptop and office computer as data back-up and the location for the operating system and applications. This means that I can easily transport all my data from office to home and back without having to copy heaps of files back and forth and remember which ones I've updated and without having a hard drive dangling off my laptop. The applications etc. are the same in both locations and all the data goes with me. The Lexar 16GB hard-drive pictured is fast and almost indestructible. But I'm rapidly running out of space and they don't make a 32GB model. I can't find another small, fast, and robust drive with a 32GB capacity. So I'm thinking of using something like this in future instead:
It's an SD card more commonly used in cameras etc. MacBooks and iMacs both have SD card slots and according to Apple there should be no problems even in installing the operating system on such a card. For computers without a slot card readers can be bought very cheaply.
So are there any drawbacks to this idea?
Monday, December 27, 2010
Marginal Cost Curve for Crude Oil
Nice figure of the marginal cost curve for crude oil:
It's included in a post on the Oil Drum by David Murphy. Of course, reality is a bit more complicated than that and Murphy's article doesn't say that this is a marginal cost curve, but it does give a rough idea. Krugman is also on board for peak oil.
Getting Around the Great Firewall
As you can see, because Blogger is blocked in China, Stochastic Trend gets no visits from there:
I am sure some people visit using a VPN, but I've come up with an alternative solution. Once a month I could post the source code of my blog to my website. I don't know if the images which are still all hosted by Google will be visible or not and all the links on the side that go back to Blogger will be blocked, but at least the text will be accessible.
If you are in China and reading this, it would be great to hear from you!
Thursday, December 23, 2010
Friday, December 17, 2010
Marginal CO2 Abatement Cost Curves from EMF22
These are my first estimates of the marginal abatement cost curves for the four main regions based on the results of the EMF22 exercise. Here I have flipped the graph back 90 degrees again. This is private marginal cost for abating fossil and industrial emissions of CO2 using market exchange rates. The EU is the most expensive region for small cuts in emissions and India the cheapest. But for extreme cuts India is most expensive. These results will look different if we measure cost differently. Note also that this meta-analysis finds very high carbon prices for large cuts in emissions. The typical numbers thrown around of $20 per tonne only apply to very small cuts in emissions. But the cost of a given emissions reduction declines over time as technology progresses.
Thursday, December 16, 2010
Marginal CO2 Abatement Cost Curve for the US
So, I turned the graph 90 degrees and replaced tonnes of abatement by percent and got this:
The percentage is emissions relative to business as usual. i.e. 100% means there is no abatement. 0% means there is 100% abatement. Yes, some models end up with negative emissions. And these are just fossil-fuel/industrial emissions of CO2. They assume that we will be burning biomass and sequestrating the carbon. This looks like a logistic curve. Especially if we dump the negative emissions data.
Wednesday, December 15, 2010
IEA Data No Longer Available at NLA
I'm reliably told that access to online IEA data at the National Library of Australia is no longer available. Maybe ANU ought to think about subscribing given how much climate research is going on at the university?
Tuesday, December 14, 2010
Marginal Abatement Cost Curve for China
The chart plots the carbon price in US Dollars (market exchange rate) against Gt of Co2 abated for China using the results from seven of the EMF-22 models. This is not really a cost curve as it includes data for different time periods and model scenarios. I've been struggling to model this data over the last 10 days or so on and off. But this is actually the first time I've plotted the data like this. It's always helpful I think to look at your data.
Fitting a straight line to this chart would imply that carbon prices are an exponential function of abatement. This is not a bad fit but something a bit more non-linear would probably work better. Another way of representing the data is to plot the carbon price against the percentage reduction in emissions:
Again, this appears to be roughly linear but a nonlinear curve would fit better.
Monday, December 13, 2010
Polar View
Some nice maps from GISS showing temperature anomalies for November in the Arctic and Antarctic:
It's clear from these, that though temperatures were low in NW Europe they were much higher than normal across Arctic Canada and Russia. For more information, visit Climate Progress
Sunday, December 12, 2010
The Green Paradox
The green paradox is the idea that a policy to reduce global warming could instead accelerate the use of fossil fuels because owners extract more fossil fuels while they are still valuable. Of course, an actual cap on emissions should avoid this green paradox, but some other policies might lead to a green paradox in theory. Quentin Grafton, Tom Kompas, and Ngo Van Long have written a paper titled "Do Biofuel Subsidies Reduce Greenhouse Gas Emissions?" that argues that subsidies to increase biofuels could plausibly accelerate the use of fossil fuels and, therefore, climate change.
Importantly, the paper assumes that the production of biofuels does not use fossil fuels itself. In fact biofuels production requires large inputs of fossil fuels, such that there is a controversy as to whether some of them yield any net energy at all. So Grafton et al.'s paper shows an additional reason why encouraging biofuel production might be a bad idea besides the low energy return on investment of biofuels and their displacement of food production.
Grafton et al. assume that extraction costs of fossil fuels are constant and that biofuels and fossil fuels are perfectly substitutable. The supply of biofuels is increasing in the net price received by producers (market price plus subsidy). Given the assumptions the price of fossil fuels rises at the rate of interest. This results in a tractable problem where at some point in time the fossil fuel price will rise sufficiently high that all fuel demand will be supplied by biofuels. Fossil fuel producers must, therefore, extract all their resources by that time. Under certain conditions the greater the subsidy to biofuel production the sooner that time will come and the faster fossil fuels will be extracted. In other words, the supply response from fossil fuel producers overwhelms the substitution effect towards biofuels on the demand side.
Making the reasonable assumption that overall demand for energy does not fall to zero for a finite price they show that the green paradox is plausible for reasonable parameter values under both competitive and monopoly extraction of fossil fuels.
Linking Book Chapters to Your Website
With Google Books it's now possible to provide links to your book chapters online without posting your own pdf of the chapter. For example:
Stern D. I. (2004) The environmental Kuznets curve, in: P. Safonov and J. Proops (eds.) Modelling in Ecological Economics, Edward Elgar, Cheltenham.
I already provide links from my publication list to RePEc for all my journal articles in RePEc (one way to increase RePEc hits) and to the doi for articles not in RePEc. There are only a couple of pages missing from the version of my chapter on Google Books.
Paul Burke's Graduation
I went along to Paul Burke's graduation as Doctor of Philosophy at ANU on Friday. As you can see I was in "civilian clothing" and sat in the audience. Here the hooding ceremony is performed by the Chancellor of the University (Gareth Evans) rather than by the graduate's PhD adviser,* as is the practice in the US. Actually, I hadn't been to a graduation in Australia before and there were some other interesting traditions involving a mace and "beadle's staves". As you can see from the picture there are some differences in academic dress between the US and the Commonwealth countries too.
Anyway, congratulations to Paul!
* I was on Paul's committee but not his primary adviser.
Thursday, December 9, 2010
OCEAN-OIL
Boston University, Louisiana State University, and the National Council for Science and the Environment (NCSE) have created a resource that will allow you to explore questions regarding the causes, magnitude and consequences of the Deepwater Horizon disaster, as well as to contribute your own expertise.
The Online Clearinghouse for Education & Networking: Oil Interdisciplinary Learning (OCEAN-OIL) is an open-access, peer-reviewed electronic education resource about the Deepwater Horizon disaster. OCEAN-OIL is funded by the National Science Foundation.
The OCEAN-OIL website is seamlessly integrated into the Encyclopedia of Earth, which is a free, peer-reviewed, searchable collection of content about the Earth, its natural environments, and their interaction with society, written by expert scholars and educators. EoE Editor-in-Chief Cutler Cleveland
In order to contribute your expertise to this initiative, follow the procedures outlined here.
For more information contact Mallory Nomack.
NCSE is holding a special one day symposium on the Gulf of Mexico, what is necessary for ecological and economic recovery, as well as the broader issues of off shore oil drilling. Former EPA Administrator William Reilly and Senator Bob Graham, Co-chairs of National Commission on the BP Deepwater Horizon Oil Spill and Offshore Drilling will keynote the symposium, which will kick off NCSE’s 11th National Conference on Science, Policy and the Environment: Our Changing Oceans, January 19-21, 2011 in Washington, DC.
"Elasticities of Substitution and Complementarity" to be published in Journal of Productivity Analysis
My paper Elasticities of Substitution and Complementarity has been accepted by the Journal of Productivity Analysis. The paper surveys the various definitions of the "elasticity of substitution" and puts them into a framework that explains their relationships and purposes. It includes the new definition of Hicks Elasticity of Substitution based on the input distance function as well as definitions of elasticities based on revenue functions and a discussion of the work of Pigou on the topic which was not cited for decades.
Wednesday, December 8, 2010
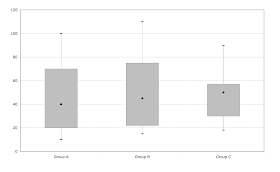
Box Plots in Excel
Strangely, Excel does not have a chart type for "box plots". In general, it's graphing capabilities are not that great. You can make an approximation to a boxplot chart using some obscure options which are quite hidden away. I used these instructions to come up with this:
Not quite as pretty as the example in Wikipedia, but probably good enough.
Google E-Books
I got an e-mail from Edward Elgar Publishing this morning announcing that they are joining Google's E-Books initiative. It was launched yesterday and is only available in the US so far. Seems it is yet another new format but will be available for many devices (unlike Amazon's Kindle).
Monday, December 6, 2010
Proposal Tips
Actually, the article is titled "How to Fail in Grant-Writing". It's kind of funny. Well, some of it is. I'm re-working my (unsubmitted) ARC proposal from last year right now...
Sunday, December 5, 2010
IPCC Position Available
IPCC is looking for Programme Manager, Communications and Media Relations based in Geneva.
CCEP Debuts on RePEc at 17th in Australia
The Centre for Climate Economics and Policy, which was just recently launched, enters the RePEc ranking for Australian economics institutions at 17th (roughly top 14%). CCEP is a network of researchers working on climate issues directed by Frank Jotzo of the Crawford School at ANU>. We have a working paper series also on RePEc (which I am administering) and a conference/workshop is planned for early next year.
CCEP is equally ranked with the National Centre for Social and Economic Modelling at University of Canberra and one place below long-established economics departments including the Arndt-Corden Department of Economics at ANU * and research groups such as that of John Quiggin at U. Queensland.
We also rank 51st in the world for energy economics and 58th for environmental economics.
* Arndt-Corden is now part of the Crawford School at ANU. The other departments ranked 16th are also subdivisions of higher ranked academic units.
Saturday, December 4, 2010
What is Business as Usual for China and India?
My paper with Frank Jotzo in Energy Policy argued that while India's goal of cutting emissions intensity by 25% between 2005 and 2020 was likely to be similar to the business as usual reduction in emissions, China's goal was much more ambitious. China aims to reduce emissions intensity by 40-45% over this time frame, while we estimated it would decline by 24% under business as usual.
By contrast, many commentators argued that China's goal was just business as usual. This was because China's strong policies to reduce energy and carbon intensity were already included in standard scenarios.
I am now revising my paper with Ross Lambie on where it is cheapest to cut carbon emissions. We will use the results of the 22nd Energy Modelling Forum (EMF22) in this revised version. So I was curious what the business as usual scenarios developed by the participating models said about China and India in the 2000-2020 period:
On average they predict a 25% reduction in emissions intensity in China from 2000 to 2010, increasing to a 27% reduction in 2010-2020. We estimated 1% and 15% reductions in these periods under BAU. There is no way that China will end up with a 25% reduction from 2000-2010. Emissions intensity rose from 2000 to 2005 and China is struggling to achieve its goal of reducing energy intensity by 20% from 2005 to 2010. Our estimates for India are pretty close to the EMF averages. The results also show a large variation in the scenarios. There is a lot of uncertainty about what is BAU.
China might achieve a 27% reduction in emissions intensity relative to 2010 by 2020 (the average given by the EMF22 models above). But it will be the result of policy action, not business as usual.
Wednesday, December 1, 2010
CCEP Working Papers Now on RePEc
You can now download CCEP Working Papers from RePEc. Since launching the series with six papers we have added a further paper by Leo Dobes: "Notes on Applying ‘Real Options’ to Climate Change Adaptation Measures, with Examples from Vietnam.
The Role of Energy in Economic Growth
A few months ago I serialized a paper I was revising on the role of energy in economic growth. I didn't include all the material in the paper and it wasn't serialized in order. The paper will be appearing next year in Ecological Economics Reviews, which is an annual edition of the Annals of the New York Academy of Sciences.
A working paper version of the paper is now available in the new working paper series of the Centre for Climate Economics and Policy.* The paper is an extensively revised and updated version of my 2004 working paper on the topic. That turned out to be my most downloaded and most cited working paper but only saw publication in a shortened form in the Encyclopedia of Energy. So I thought an update with journal publication would be a good idea! The main novelty in the new paper is the synthesis section which presents a very simple unified growth theory model. I have another working paper that will appear shortly that provides much more detail on that topic, so will reserve comment until then.
*The paper is also available on SSRN as my first contribution to the USSEE/IAEE Working Paper Series.