Strangely, Excel does not have a chart type for "
box plots". In general, it's
graphing capabilities are not that great. You can make an approximation to a boxplot chart using some obscure options which are quite hidden away. I used
these instructions to come up with this:
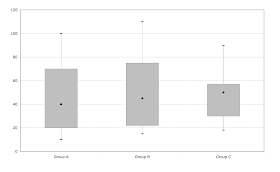
Not quite as pretty as the example in Wikipedia, but probably good enough.

No comments:
Post a Comment