Friday, January 11, 2013

ANU is Number One in the World...

On mean kilometres between collaborators on papers! On average our collaborators are 4,522km from us:


This is just one the rankings you can get from the Leiden Ranking of universities. They aim to be more transparent than other well-known rankings like the Shanghai Jiaotong or QS rankings. Another very interesting feature are confidence intervals obtained by boot-strapping.

ANU does not rank very well by more conventional measures of impact. The authors preferred ranking is by the PP top 10% indicator. This is the percentage of a university's publications that are in the top 10% most cited publications. It's not source normalized, however, so universities with strong biomedical research efforts will rank higher. ANU is ranked only 114th with 12.9%. But note that even the top school - MIT - only scores 25.2%. So there is not much variation across most of the 500 research universities.

Another ranking is by source normalized impact factor. This should take into account the differences between disciplines. ANU ranks 118th with an impact of 1.21. MIT has an impact of 2.17. So there is again little variation. Much less variation than among journals which have less variation than individual researchers, which have less variation than articles. I'm actually surprised how little variation there is across universities. Of course, all these are research oriented universities, but still.

Something missing from these ranking is the average number of articles per researcher. It's not possible to work this out from the Web Science in any accurate way. Based on the RePEc rankings Australian economists publish above average numbers of papers given their RePEc rank, but these are cited less. I suspect because of the distance of Australia from elsewhere, despite our high levels of international collaboration.

First International Workshop on Econometric Applications in Climatology

There is a Call for Papers for the First International Workshop on Econometric Applications in Climatology to be held at the University of Guelph, Canada June 5-7, 2013. The deadline is 28 February.

It is interesting that there is enough activity in this space to hold a conference. It has definitely been attracting more and more attention. We - Robert Kaufmann and I - were pioneers in this area starting with our paper in Nature in 1997. Despite the relative success of this first paper I didn't find it an easy field to make much headway in and gave up on that line of inquiry around 2005-6. Robert persevered with some success. I now actually have a new paper in preparation. I hoep to get round to finishing it later this month. Maybe I should submit it to this conference?

Uncertainty Measures for Economics Journal Impact Factors

I have a new working paper out - Uncertainty Measures for Economics Journal Impact Factors. A version of the paper will appear in the March issue of the Journal of Economic Literature together with a couple of other papers on publishing in economics - one by Daniel Hamermesh and the other by Stefano Della Vigna and David Card. Some of the most recent literature review was posted here. I first blogged on this topic early last year starting with calculating the confidence interval for the Journal of Economic Growth's two year impact factor. In the end I did this for all economics journals that had a five year impact factor in the Journal Citations Reports. All 230 of them. The following graph shows the confidence intervals:

I used a stock price chart in Excel to generate this graph! As you can see, the top two journals - Journal of Economic Literature (JEL) and Quarterly Journal of Economics (QJE)  - are in a distinct class on their own. There is also a tail of a few very weak journals. I wonder why these are included in the Web of Science which deliberately only includes journals with decent citation rates. For the vast majority of journals it is hard to tell what rank they should have given the impact factor for a single year anyway. Certainly, small changes in rank from year to year which journals like to publicize when they increase have little meaning. Journals with very wide confidence intervals are those that publish few articles or have very skewed citations. In particular, the Journal of Experimental Economics ranked 23rd had one star article with far more citations than any other in the journal. It still has a respectable impact factor (1.8) without that article.

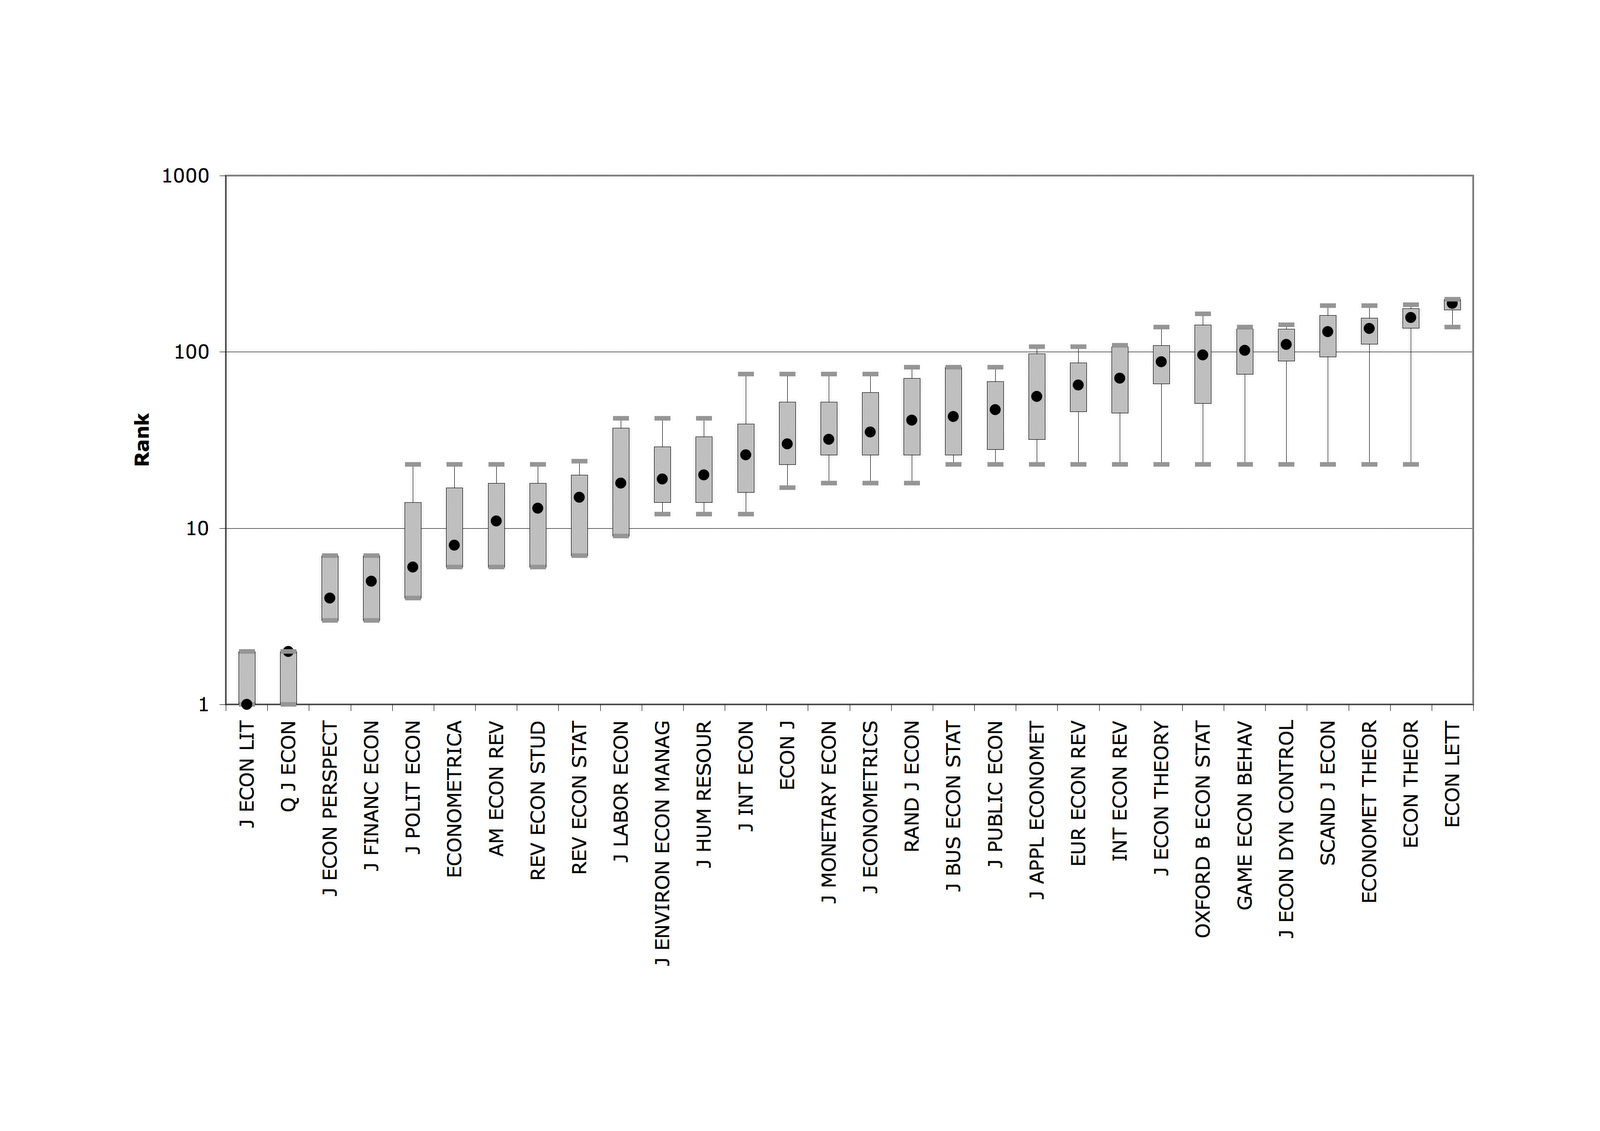
Another way of presenting the data is in terms of the range of ranks that could be ascribed to each journal:

For this graph I used the secret method for producing box plots in Excel.The shaded boxes is the continuous range of ranks that are are not statistically significantly different to the estimated rank (black dot) at the 95% confidence level. The whiskers indicate the most extreme outlying journals that have statistically insignificantly different ranks. The graph only shows the analysis for a subsample of 30 journals, though I compared each of these journals against all 229 other journals to derive the box plot. It's clear from this how much uncertainty there is over the exact ranks of most journals. The impact factor is the mean number of citations each article published in the journal got. Instead we can look at the median:

As the number of citations received by an article must be an integer the medians must be either integers or be half way between two integers. As most articles don't get many citations that means that most medians are zero or one. On the basis of medians, huge swathes of journals have equal rank, though the different medians seem to be significantly different from each other. If you're wondering about the dot on the left, JEL has the highest impact factor but its median of 3 is only half that of the QJE's.

Does this mean that impact factors are meaningless? I don't think so, but don't sweat small differences in impact factors when deciding where to submit your next academic paper.

Signs of Fracking


For more around a decade methane concentrations in the atmosphere were pretty much constant from year to year. In the last few years they have begun to creep up again Is that the sign of the fracking boom? Some research finds that methane leakage from fracking is much greater than from traditional gas fields and supply networks. We estimated that gas supply was the smallest anthropogenic source and gas flaring had declined from its peak contribution:


Flaring might also be again increasing. Climate Progress posted this image of gas flaring in North Dakota:

Friday, January 4, 2013

World Scientific Output

From Information Processing - Number of scientific papers in 2012 and proportion of highly cited ones.


Australia (population = 23 million) has a decent showing with roughly double the output of Sweden (9.5 million) in terms of total papers and highly cited ones and half the output of the UK (63 million).

Thursday, January 3, 2013

Other Emissions of Greenhouse Gases and Aerosols

I only cover three other types of emissions besides energy related CO2. I thought of including black carbon but in the end decided to skip it as I already have too many papers. I resisted the temptation to try to include two of my papers in the collection, though I ended up discussing my paper more below :) I also include a graphic that will not be appearing in our book. It is from Smith et al. (2011) and compares the various estimates of sulfur emissions.

Deforestation and land-use change is an important source of emissions of CO2. Levels of emissions are much lower than from energy related sources, more stable over time, but also very uncertain. Houghton (2003) presents estimates of CO2 emissions from land-use change from 1850 to 2000, globally and by region. In general the tend rises from 1 to 2 Gt C over the 150 years with an acceleration in the trend around 1950 in common with emissions from energy related sources. Therefore, there is a clear link with economic growth. Tropical deforestation, particularly in Asia and Latin America dominates. In recent decades there is net reforestation in developed countries. Unusually, the data are increasingly uncertain in recent decades with estimates from different researchers varying substantially (Houghton, 2010).

The third most important greenhouse gas in the atmosphere and the second most important anthropogenic source is methane. Relatively little work has been done on CH4 in comparison to CO2. Stern and Kaufmann (1996) used available data to reconstruct the first time series of historic emissions from 1860-1993. They found that anthropogenic emissions had increased from 80 million tonnes of carbon in 1860 to 380 million in 1990. The relative importance of the various emissions sources changed over time though rice farming and livestock husbandry remained the two most important sources.

Offsetting the radiative forcing due to greenhouse gases is a significant negative forcing due to aerosols derived from sulphur oxide (primarily dioxide) emissions. These aerosols do not persist in the atmosphere for usually more than a few days and so the source of emissions is important and effects are localized though they spread far beyond the sources to affect neighbouring countries. The main sources of anthropogenic sulphur emissions are the combustion of coal and metal smelting. Stern (2006) showed that that after increasing fairly steadily from 1850 to the early 1990s global emissions began to trend downwards. Emissions in Western Europe and North America as well as Japan had already been trending down since 1970 primarily due to policies to reduce acid rain (Stern, 2005). But this decline was offset by growth in other regions. Following 1990, there was a dramatic reduction in emissions from Eastern Europe and the former Soviet Union. The likelihood that emissions will continue to decline in the future will contribute to future warming. Whereas Stern (2006) uses a combination of previously published data and model estimates, Smith et al. (2011) provide an inventory of sulphur emissions from 1850 to 2005 using a uniform methodology. The results largely confirm Stern’s (2006) findings though the levels are generally lower by a few percent.


References

Houghton, R. A. (2003) Revised estimates of the annual net flux of carbon to the atmosphere from changes in land use and land management 1850-2000, Tellus 55B: 378-390.

Houghton, R. A. (2010) How well do we know the flux of CO2 from land use change? Tellus 62B: 337-351.

Smith, S. J., J. van Ardenne, Z. Klimont, R. J. Andres, A. Volke, S. D. Arias (2011) Anthropogenic sulfur dioxide emissions: 1850-2005, Atmospheric Chemistry and Physics 11: 1101-1116.

Stern D. I. (2005) Beyond the environmental Kuznets curve: Diffusion of sulfur-emissions-abating technology, Journal of Environment and Development 14(1), 101-124.

Stern D. I. (2006) Reversal in the trend of global anthropogenic sulfur emissions, Global Environmental Change 16(2), 207-220.

Stern D. I. and R. K. Kaufmann (1996) Estimates of global anthropogenic methane emissions 1860-1993, Chemosphere 33, 159-176.

Rogelj et al. Mitigation Paper in Nature

The latest issue of Nature has a paper on climate mitigation by Rogelj et al. The issue also has a "News and Views" item by Steve Hatfield Dodds on the paper. The paper has an interesting message*: Delay in acting on mitigation has the biggest effect on the probability of achieving the 2C target, carbon taxes above $20-40 per tonne have little effect on mitigation, and carbon capture and storage (CCS) is essential. This is a message that environmentalists, business, and fossil fuel producers will like. As Steve points out, one weakness of the paper is that it is all done with the MESSAGE integrated assessment model and that is kind of a black box. In the EMF-22 modelling exercise, MESSAGE had some of the lowest carbon taxes. For a 450 ppm scenario its 2020 carbon tax was only $15. By contrast, FUND had a $260 carbon tax. So MESSAGE is an optimistic model. Other models definitely don't have this carbon tax saturation phenomenon as can be seen from our meta-analysis.

Our PhD student Hyung-Sup Lee's PhD thesis will provide a similar kind of uncertainty analysis purely on the economic side of things using that EMF-22 data.

* Pun kind of intended :)

Wednesday, January 2, 2013

Decomposing Emissions

Latest installment.

The Kaya identity decomposes total energy-related emissions into the product of population, income per capita, energy intensity, and carbon intensity of energy carriers (Kaya, 1997). It is an extension of the IPAT identity (Ehrlich and Holdren, 1971) that decomposes its technology factor into two more factors. It is important to understand that this framework is an accounting identity and not a causal model. For example, growth in income per capita might drive or be associated with reduced energy intensity so that the factors are not independent.

Raupach et al. (2007) is a highly cited example of this literature. They show that global emissions growth since 2000 was driven by a cessation or reversal of earlier declining trends in the energy intensity of gross domestic product (GDP) (energy/GDP) and the carbon intensity of energy (emissions/energy), coupled with continuing increases in population and per-capita GDP. Nearly constant or slightly increasing trends in the carbon intensity of energy were observed in both developed and developing regions and no region was significantly decarbonizing its energy supply. The growth rate in emissions was strongest in rapidly developing economies, particularly China. This research group also published another highly cited paper in 2007 linking emissions growth and its drivers to the atmospheric concentration of carbon dioxide (Canadell et al., 2007).

Many papers examine the role of particular Kaya factors in explaining historical emissions and driving future projections. The most important factor driving declining energy intensity and to some degree carbon intensity is technological change. Grübler et al. (1999) present a framework for energy technology analysis and discuss methods that can be used to analyze the impact of technological changes on global warming. In the historical record, they identify characteristic “learning rates" for the reduction in cost of energy technologies that allow simple quantified characterization of the improvement in cost and performance due to cumulative experience and investments. They also identify patterns, processes and timescales that typify the diffusion of new technologies in competitive markets. Technologies that are long-lived and are components of interlocking networks typically require the longest time to diffuse and co-evolve with other technologies in the network; such network effects yield high barriers to entry even for superior competitors. The authors show how it is possible to include learning phenomena in micro- and macro-scale models. Doing so can yield projections with lessened environmental impacts without necessarily incurring a negative effect on the economy.

The authors also address the final Kaya factor – carbon intensity of energy. They show that over time the fuels that power the economy have had progressively more energy per unit of carbon pollution - from coal to oil to gas. Such replacement has historically “decarbonized'' the global primary energy supply 0.3% per year.

Besides technological change another potential driver of declining energy intensity is structural change of economy towards a service oriented economy. It is usually thought that such an economy will have lower energy intensity and, therefore, emissions intensity of income. Henriques and Kander (2010) argue that this interpretation is overly optimistic because the shift to a service economy is somewhat of an illusion in terms of real production. The share of an industry in the economy is a function of both the real level of production and the price of output. The share of the manufacturing sector has declined in developed countries because rapid productivity gains have reduced its output price relative to the service sector. When constant prices are used, less of a shift to a service economy is seen. The main driver of the decline in energy intensity in developed countries is, therefore, productivity gains in manufacturing. For emerging economies like Brazil, Mexico and India, it is the residential sector that drives energy intensity down because of the declining share of this sector as the formal economy grows, and as a consequence of switching to more efficient fuels.

Another important issue related to the decomposition literature is to what degree trade and foreign investment have allowed developed countries to reduce their apparent energy intensity. Since the early days of the environmental Kuznets curve literature this was seen as a potential explanation of reduced pollution in developed economies (Stern et al., 1996). Most mainstream economists (Levinson, 2010) and economic historians (e.g. Kander and Lindmark 2006) have argued that the role of trade. Peters and Hertwich (2008), however, find that most developed countries were net importers of embodied carbon dioxide emissions in 2001 – in other words, their imports required more emissions to produce than their exports did. For the United States the difference amounted to 120 Mt C while for the UK it was 28 Mt. But this does not imply that if they produced all these products at home their net emissions would be this much higher. This is because production in developing countries is much more energy intensive than in developed countries when measured at market exchange rates and some developed countries, in particular China and India are particularly carbon intensive. This explains the differences on this issue between economists and researchers from engineering backgrounds.

A little researched topic is what happens to the Kaya factors in the short-run over the course of the business cycle. In a response to Peters et al. (2012), Jotzo et al. (2012) hint that the rate of change in energy intensity follows a strong cycle with the rate of decline slowing in the aftermath of recessions and increasing later in the business cycle. Alternatively, emissions could be seen as responding asymmetrically to increases and decreases in income (York, 2012).

References

Canadell, J. G., C. Le Quéré, M. R. Raupach, C. B. Field, E. T. Buitenhuis, P. Ciais, T. J. Conway, N. P. Gillett, R. A. Houghton, and G. Marland (2007) Contributions to accelerating atmospheric CO2 growth from economic activity, carbon intensity, and efficiency of natural sinks, Proceedings of the National Academy of Sciences 104(47): 18866–18870.

Ehrlich, P. R. and J. P. Holdren (1971) Impact of population growth, Science 171(3977): 1212-1217.

Grübler, Arnulf, Nebojsa Nakicénovic, and David G. Victor (1999) Dynamics of energy technologies and global change, Energy Policy 27: 247-280.

Henriques, Sofia Teives, and Astrid Kander (2010) The modest environmental relief resulting from the transition to a service economy, Ecological Economics 70(2): 271-282.

Jotzo F., P. J. Burke, P. J. Wood, A. Macintosh, and D. I. Stern (2012) Decomposing the 2010 global carbon dioxide emissions rebound, Nature Climate Change 2(4): 213-214.

Kander, Astrid and Lindmark, Magnus, 2006. "Foreign trade and declining pollution in Sweden: a decomposition analysis of long-term structural and technological effects," Energy Policy, Elsevier, vol. 34(13), pages 1590-1599, September.

Kaya, Y. and K. Yokobori (1997) Environment, Energy, and Economy: Strategies for Sustainability, United Nations University Press.

Levinson, A. (2010) Offshoring Pollution: Is the United States Increasingly Importing Polluting Goods? Review of Environmental Economics and Policy 4(1): 63-83.

Peters, Glen P. and Edgar G. Hertwich (2008) CO2 Embodied in International Trade with Implications for Global Climate Policy, Environmental Science and Technology 42(5): 1401-1407.

Peters, Glen P., Gregg Marland, Corinne Le Quéré, Thomas Boden, Josep G. Canadell & Michael R. Raupach (2012) Rapid growth in CO2 emissions after the 2008–2009 global financial crisis, Nature Climate Change 2, 2–4.

Raupach, Michael R., Gregg Marland, Philippe Ciais, Corinne Le Quéré, Josep G. Canadell, Gernot Klepper, Christopher B. Field (2007) Global and regional drivers of accelerating CO2 emissions, Proceedings of the National Academy of Sciences 104(24): 10288-10293.

Stern D. I., M. S. Common, and E. B. Barbier (1996) Economic growth and environmental degradation: the environmental Kuznets curve and sustainable development, World Development 24, 1151-1160.

York, R. (2012) Asymmetric effects of economic growth and decline on CO2 emissions, Nature Climate Change 2(11): 762-764.

Tuesday, January 1, 2013

Carbon Emissions, The Environmental Kuznets Curve, and Convergence

I'm going to include one paper on the EKC and one on convergence.

The most popular approaches to explaining historical emissions are the environmental Kuznets curve and the decomposition approach using the Kaya identity. These approaches can also be used to produce simple projections of future emissions given information on the relevant drivers.

The environmental Kuznets curve hypothesis proposes that concentrations or per capita emissions of various pollutants rise and then fall as per capita income increases. Static and dynamic theoretical models are given by Plassmann and Khanna (2006) and Brock and Taylor (2010) respectively, while Carson (2010) provides a recent survey. For carbon dioxide the relevant variable is emissions per capita. Following the original paper on the topic by Grossman and Krueger (1991), the World Bank published an issue of the World Development Report timed for the Rio de Janeiro Earth Summit in 1992 that featured an environmental Kuznets curve for carbon dioxide among various environmental indicators. The econometric estimates showed that per capita carbon emissions rise monotonically with per capita income within the observed range (Shafik, 1994). This result was confirmed by Holtz-Eakin and Selden (1995), which is the classic paper on the carbon EKC. They found also found a monotonic relationship between income per capita and CO2 emissions though the propensity to emit with income declines. Recent papers by Wagner (2008), Vollebergh et al. (2009) and Stern (2010) that use different econometric methods do not substantially change the conclusions despite some intervening papers (e.g. Schmalensee et al. 1998) that claimed that there was an inverted U shaped curve for CO2 with an in sample peak. This is also a paper that has stood the test of time in terms of projected emissions to date, though future projected emissions are lower than Edmonds and Reilly (1983) or RCP 8.5.

A related literature looks at whether per capita emissions are converging over time across countries. If there is convergence in GDP per capita then if the income emissions relation is monotonic there should also be convergence in emissions, at least conditionally. Strazicich and List (2003) examined the time paths of carbon dioxide emissions in twenty-one industrial countries from 1960–1997 to test for stochastic and conditional convergence. They performed estimated both panel unit root tests and cross-section regressions. Overall, they found significant evidence that CO2 emissions have converged. Subsequent research has tested whether this result holds across both developed and developing countries with mixed results (e.g. Aldy, 2006; Westerlund and Basher, 2008; Brock and Taylor, 2010).

References

Aldy, Joseph E. (2006) Per capita carbon dioxide emissions: convergence or divergence? Environmental and Resource Economics 33(4): 533-555.

Brock, William A. and M. Scott Taylor (2010) The green Solow model, Journal of Economic Growth 15:127–153.

Carson, R. T. (2010) The environmental Kuznets curve: Seeking empirical regularity and theoretical structure, Review of Environmental Economics and Policy 4(1): 3-23.

Edmonds, Jae and John Reilly (1983) Global energy and CO2 to the year 2050, The Energy Journal 4(3): 21-48.

Grossman, G. M. and A. B. Krueger (1991) Environmental impacts of a North American Free Trade Agreement, National Bureau of Economic Research Working Paper 3914, NBER, Cambridge MA.

Holtz-Eakin, Douglas and Thomas M. Selden (1995) Stoking the fires? CO2 emissions and economic growth, Journal of Public Economics 57(1): 85-101.

Plassmann, Florenz and Neha Khanna (2006) Preferences, Technology, and the Environment: Understanding the Environmental Kuznets Curve Hypothesis, Amer. J. Agr. Econ. 88(3) (August 2006): 632–643.

Schmalensee, R., T. M. Stoker and R. A. Judson (1998), ‘World Carbon Dioxide Emissions: 1950-2050’, Review of Economics and Statistics, 80, 15-27.

Shafik N., Economic development and environmental quality: an econometric analysis, Oxford Economic Papers 46, 757-773 (1994).

Stern D. I. (2010) Between estimates of the emissions-income elasticity, Ecological Economics 69, 2173-2182.

Strazicich, Mark C. and John A. List (2003) Are CO2 emission levels converging among industrial countries? Environmental and Resource Economics 24(3): 263-271.

Vollebergh, Herman R.J., Bertrand Melenberg, and Elbert Dijkgraaf (2009) Identifying reduced-form relations with panel data: The case of pollution and income, Journal of Environmental Economics and Management 58(1): 27-42.

Wagner, M., 2008. The carbon Kuznets curve: A cloudy picture emitted by bad econometrics. Resource and Energy Economics 30, 388-408.

Westerlund, Joakim and Syed A. Basher (2008) Testing for convergence in carbon dioxide emissions using a century of panel data, Environmental and Resource Economics 40:109–120.

Most Popular Posts 2012

These are the most popular new posts in 2012. In general my readers are interested in journal rankings and impact and jobs but also some other topics. These numbers are based on my Google Analytics reports. The stats that Google now provides within Blogger would give a somewhat different hit list.

1. PLOS One's 2011 Impact Factor. PLoS ONE is the world's biggest journal and so a lot of people are interested in its impact factor. A lot of the hits on my blog are PLoS ONE related.

2. In Defence of Elsevier. Being controversial helps hits :)

3. Several Crawford Jobs Available. I posted the link on RESECON and got lots of hits.

4. The Rise and Fall of Ecological Economics. This is more of a surprise in terms of number of hits.

5. Scientific Collaboration Networks. These maps are cool.

6. 2011 Journal Citation Report Released. More journal rankings.

7. Acceptance Rates in the Top Environmental Economics Journals. More on getting published, or not.

8. Google Scholar Metrics. Another way to rank journals.

9. Calculating an Individual Impact Factor Using Scopus. A way to compare individual researchers to journals. And it is pretty easy to do.

10. The Inside Story on the 2010 ERA Economics Journals Rankings. Yet more on journal rankings.

Monday, December 31, 2012

Scenarios and Forecasts of CO2 Emissions

Today's installment. This is another four papers, marked in bold the first time they appear. I can see already that either I am going to have to cut the number of papers covered or we are going to have to go to two volumes, which is an option. Also, I gave up and actually included an IPCC report in my list.

******

Economists first addressed the issue of climate change as part of the wave of interest in energy and environmental economics that followed the oil price shock in 1973-4. The first journal article on the issue is d’Arge et al. (1982), which references an earlier report (d’Arge et al., 1975) and conference paper by the authors.

Early scenarios and projections for future emissions of carbon dioxide were published the following year (Nordhaus and Yohe, 1983; Ausubel and Nordhaus, 1983; Edmonds and Reilly 1983). Edmonds and Reilly’s model was the basis of the energy module of the later IS92 scenarios. It consists of a multiregional supply and demand model for seven primary and secondary energy carriers. Aggregate energy demand is determined by GNP, which is driven by exogenous technological change, and autonomous energy efficiency improvements for each fuel type. There is also a feedback from energy prices to GNP. Predicted carbon emissions rose to 6.9 billion tonnes in 2000, 12.3 billion in 2025 and 26 billion by 2050 with an increasing share of emissions in the non-OECD world. The near-term prediction was remarkably accurate - actual global emissions were 6.8 billion tonnes in 2000. Predicted emissions for 2050 are higher than current BAU projections as we will see below. Carbon dioxide concentrations were predicted to double between 2049 and 2067 relative to the preindustrial level, which is in line with current BAU projections.

Many of the most important studies of future emissions have been published as reports of the Intergovernmental Panel on Climate Change (IPCC) and other agencies. The IPCC has commissioned emissions scenarios roughly every decade – the IS92 scenarios (Leggett et al., 1992), SRES scenarios (Nakicenovic et al., 2000), and RCP scenarios (van Vuuren et al., 2011).

The first IPCC scenarios were produced in 1989. Due to the ending of communism in the USSR and Eastern Europe, the signing of an international agreement on the control of CFCs and new information in various input variables, the IPCC requested a revision only two years later (Leggett et al., 1992). These new scenarios were inputs to the 1992 Supplementary Report and the 1995 Second Assessment Report. These were the first scenarios to include the full suite of greenhouse gases as well as sulphur emissions (Nakicenovic, 2000). In addition to the energy module described above there are deforestation, agriculture, and halocarbon emission modules. Control of sulphur emissions is modelled as an increasing function of income level and an atmosphere/ocean module translates emissions into climate change. The scenarios modelled six alternative future worlds and comprehensively covered all sources of greenhouse gases translating them into CO2 equivalents. Scenarios varied on assumed population and economic growth and the availability of alternative energy technologies and fossil fuel resources. These scenarios result in a very broad range of emissions trajectories. IS92e saw emissions rising to the 20 GT range around 2050 and the 35 GT by 2100. IS92c predicted that emissions would decline after 2020. The preferred scenario, IS92a, was midway between these extremes with emissions around 20 GT in 2100.

The SRES scenarios prepared for the Third Assessment Report (Nakicenovic et al., 2000) are perhaps the best known of the IPCC scenarios. Nakicenovic (2000) discusses the development of these scenarios. Four storylines were developed which vary by population and economic growth, degree of international cooperation and trade, the rate of technological development, and the types of future policies. Five integrated assessment modeling groups cooperated to develop a total of forty scenarios based on the storylines. The results from one of the modeling groups was considered the representative or “marker” scenario of the storyline. The ensemble of results portray greater radiative forcing than the IS92 scenarios mainly because of reduced forecasts of sulfur emissions. The marker A1 and A2 scenarios also project less carbon emissions in 2050 than Edmonds and Reilly (1983).

van Vuuren et al., (2011) introduce the latest IPCC scenarios known as the Representative Concentration Pathways (RCP) prepared for the Fifth Assessment Report. This process is the reverse of previous scenario-building exercises as it starts with concentration pathways based on given radiative forcing targets and then works back to socio-economic scenarios that could lead to those outcomes. These pathways were supposed to be representative of the range of scenarios in the literature and are named for the level of radiative forcing in Watts per square metre in 2100. The RCP 8.5 and 6.0 scenarios might be seen as business as usual under more or less optimistic assumptions about technological change while the RCP 4.5 and 2.6 scenarios assume policy to control emissions. The RCP 2.6 scenario results in negative emissions in the second half of the 21st century which is only possible with biomass carbon capture and storage or air capture of carbon dioxide. Emissions under the RCP 8.5 scenario track those in Edmonds and Reilly (1983) while they are lower in the other scenarios.

References

Ausubel, J. H. & W. D. Nordhaus (1983) A review of estimates of future carbon dioxide emissions, in T. F. Malone (ed.) Changing Climate: Report of the Carbon Dioxide Assessment Committee, National Academy Press, Washington DC. Chapter 2.2 pp153-185.

  d’Arge, R. C. et al. (1975) Economic and Social Measures of Biologic and Climatic Change, U.S. Department of Transportation.

d'Arge, Ralph C., William D. Schulze, and David S. Brookshire (1982) Carbon dioxide and intergenerational choice, American Economic Review 72(2): 251-256.

Edmonds, Jae and John Reilly (1983) Global energy and CO2 to the year 2050, The Energy Journal 4(3): 21-48. 

Leggett, J., W. J. Pepper, and R. J. Swart (1992) Emissions scenarios for the IPCC: an update, in: J. T. Houghton, B. A. Callander, and S. K. Varney (eds.) Climate Change 1992: The Supplementary Report to the IPCC Scientific Assessment, Cambridge University Press. Chapter A3, 69-96. 

Nakićenović, Nebojša (2000) Greenhouse gas emissions scenarios, Technological Forecasting and Social Change 65(2): 149–166.

Nakicenovic, Nebojsa et al. (2000) Special Report on Emissions Scenarios: A Special Report of Working Group III of the Intergovernmental Panel on Climate Change, Cambridge University Press.

Nordhaus, W. D. and G. W. Yohe (1983) Future paths of energy and carbon dioxide emissions, in T. F. Malone (ed.) Changing Climate: Report of the Carbon Dioxide Assessment Committee, National Academy Press, Washington DC. Chapter 2.1, pp87-152. 

van Vuuren, Detlef P., Jae Edmonds, Mikiko Kainuma, Keywan Riahi, Allison Thomson, Kathy Hibbard, George C. Hurtt, Tom Kram, Volker Krey, Jean-Francois Lamarque, Toshihiko Masui, Malte Meinshausen, Nebojsa Nakicenovic, Steven J. Smith, and Steven K. Rose (2011) The representative concentration pathways: an overview, Climatic Change 109(1-2): 5-31.  

My Year in Review 2012

This year was not quite as eventful as last - it was mainly a case of following through with things started or planned last year - but there is plenty to report.

In January I took over as Research Director in the Crawford School a role that covers both research related administration and leadership and being director of PhD study in the School. One of my first tasks was contributing to ANU's ERA 2012 submission. We were happy to see that our efforts and those of all the researchers that we were reporting on were rewarded with an improvement in ANU's score in economics compared to 2010. There were other big developments in Crawford's Research Profile over the year. CAMA moved to the Crawford School from the College of Business, which boosted Crawford's RePEc ranking in Australia to the top 5. We have made several other appointments and most importantly hired Bob Costanza to one of the Public Policy Chairs. Warwick McKibbin who moved to Crawford with CAMA in August was the first. Bob is the most cited person at ANU on Google Scholar Citations. Bob and Ida Kubiszewski have been visiting Crawford since August.

Old Canberra House, Crawford School, ANU

My role as PhD director took up more of my time but mostly it is a case of improving policies and processes and moving students through the milestones of the PhD. It's good that I have a great team working with me. I couldn't possibly do the job without the help of Robyn Walter who is our PhD administrator. I was also helped by PhD convenors in economics - Amy Liu, in policy and governance - Andy Kennedy, and Colin Filer for economics. Last and definitely not least is Megan Poore who has been acting PhD academic skills adviser since May. Megan has done a really great job working with PhD students one and one and in workshops and courses and steered the first year students committee in putting on our annual PhD Conference.

I published five papers this year. The paper in the Journal of Economic Surveys on interfuel substitution had been "in press" since 2010 but was finally included in a formal journal issue this year. I think we will be seeing fewer of these long gestations in the future. My other single author paper - on energy efficiency trends - was only in press since March. I first submitted it in 2010 though. I also published three papers with co-authors. A paper on the costs of reducing carbon emissions with Jack Pezzey published in AJARE, my first paper with Astrid Kander using long-run historical energy and growth data, and a short piece with four other ANU coauthors on decomposing the steep rise in global carbon emissions in 2010 in Nature Climate Change. The paper with Astrid was also my first successful publication in the Energy Journal. My chapter in the Encyclopedia of Environmetrics on ecological economics was also officially published and we had two articles published on The Conversation.


So far for 2013, I have one paper in press (see below) and a revise and resubmit. I only put out one working paper in 2012. There are lots of partly finished papers that we need to make progress on over the next couple of months. I have discussed or hinted at some of these ideas on this blog. I'll report on them in detail as they are gradually finalized.

Work began on the research funded by the ARC grant we were awarded last year. The most important activities this year have been Astrid Kander's visit to Canberra to collaborate on the project - writing a couple of those unfinished papers - and the search for a post-doctoral research fellow. We got a strong response to the advertisement (mainly through RESECON) and recently interviewed some candidates and are in the process of making an offer.

Earlier in the year, Stephan Bruns and Christian Gross visited Canberra. Stephan spent most of June working with me and I then went to the IAEE meeting in Perth and met up with Christian who then came to Canberra for a day before going on to the Schumpeter conference in Brisbane. We have several unfinished papers in progress :)

Perth
 
In addition to the IAEE meeting in June, I also participated in the MAER meta-analysis in economics workshop in Perth in September. They were the only two conferences I went to in 2012. I'm not a big conference-goer. I gave a couple of invited seminars. One at University of Western Australia and the other at Wirtschaftsuniversität Wien.

I went on two international trips driven by the IPCC Working Group III meetings in Wellington, NZ and Vigo, Spain. The first meeting was to progress from the so-called zero-order draft of the 5th Assessment Report to the first-order draft which was then opened to comments by reviewers. At the Vigo meeting we began the response to these comments and the views of the co-chairs on how the draft needs to change. The final meeting for us will be in Ethiopia next July. I took the opportunity for further travel before the NZ meeting and after the meeting in Spain.


Mount Ruapehu, North Island, NZ

On the teaching front, I taught a new course - Energy Economics - in the second semester. Based on the student evaluations, it was a great success. They especially liked the guest lectures I organized by Chris Short, Hugh Saddler, Paul Burke, and Astrid Kander.

I also again taught an introductory microeconomics course - Economic Way of Thinking I and gave a series of three lectures in our flagship CRWF 8000 course in each semester as well as a few guest lectures.

Finally, I also do a lot of refereeing and editing work... In my role as associate editor of Ecological Economics. I was involved in the dispute between Tol and Ackerman resulting in the posting of comments by me and them in the journal.

Things lined up for 2013 include a visit to Ethiopia and a paper in the March issue of the Journal of Economic Literature.

Tomorrow there'll be a post on the most popular blogposts of 2012.

Sunday, December 30, 2012

Effect of Emissions Growth on the Climate

As usual, I'm going to serialize the review I'm writing as I write. Any comments and suggestions are welcome. I've marked in bold the actual papers that will be included in the collection. I'm also thinking to include the Keeling et al. (1976) paper but we have limited space and a long way to go. Another question is whether to include the highly cited paper by Plass in Tellus or the less technical one in American Scientist.

The science of the so-called greenhouse effect has its origins in the 19th century in the work of Joseph Fourier (1827) and John Tyndal (1861) (Held and Soden, 2000). The latter discovered that carbon dioxide and water vapour were the main greenhouse gases. Svante Arrhenius (1896) more fully quantified the greenhouse effect and was the first to raise the issue of the effect of anthropogenic carbon emissions on the global climate. However, Arrhenius thought that the effect of such climate change would be beneficial to society (Kunnas, 2011). Callendar (1938) compared the expected warming effect from accumulated anthropogenic carbon dioxide emissions since the beginning of the century of 0.03°C per decade to the actual warming rate of 0.05C per decade. This was the first analysis of past human-induced warming. However, in predicting future CO2 concentrations he ignored economic growth and so predicted a concentration of 396ppm in 2100, a level that we have already reached and a warming of only 0.5C as he ignored the water vapour feedback that roughly doubles the effects of increased carbon dioxide. Several papers published by Plass in 1956 raised the alarm on climate change in a significant way for the first time. In the most cited of these, Plass (1956a) estimated that carbon dioxide concentrations would rise 30% over the 20th Century and temperatures would increase by 1.1ºC and that warming of the climate would continue for centuries if fossil fuels were extensively exploited. Plass (1956b) presented a less technical account with a clearer warning on future warming. In it he estimated that burning all then known fossil fuel reserves would raise global temperature by 7C once long-run equilibrium of calcium carbonate solution in the oceans was reached. Plass overestimated the direct effect of carbon dioxide, ignored the water vapour feedback and the length of time for the oceans to reach temperature equilibrium, and of course underestimated fossil fuel resources significantly. Still his estimate of the sensitivity of the climate to doubling carbon dioxide was not much higher at 3.8C than today’s consensus estimate of 3ºC (Knutti and Hegerl, 2008).

Regular measurement of atmospheric CO2 concentrations started two years later on Mauna Loa, Hawaii following the International Geophysical Year of 1957 (Keeling, 1960). Within a few years it was obvious that concentrations were rising consistently year by year (Keeling et al. 1976). Attention turned to the first long-run time series reconstruction of anthropogenic CO2 emissions from 1860 to 1969 (Keeling, 1973). Keeling’s results have stood the test of time and are very close to the most recent estimates. Global emissions from fossil fuel use rose from 93 million tonnes of carbon content in 1860 to 3,726 million tonnes of carbon in 1969. Cement production added another 74 million tonnes in 1969.

The articles discussed above show that the anthropogenic climate change problem has been discussed for much longer than may popularly be assumed. William Ruddiman (2003) argued in a controversial paper that anthropogenic climate change itself may be much older than was previously assumed by scientists and in fact anthropogenic emissions of these gases first altered atmospheric concentrations thousands of years ago. He makes three arguments to support his thesis. First, cyclic variations in CO2 and methane driven by Earth-orbital changes during the last 350,000 years predict decreases throughout the last 10,000 years, but the CO2 trend began an anomalous increase 8000 years ago, and the methane trend did so 5000 years ago. Second, published explanations for these gas increases based on natural forcing can be rejected based on paleoclimatic evidence. Third, a wide array of evidence points to anthropogenic changes resulting from early agriculture in Eurasia, including the start of forest clearance by 8000 years ago and of rice irrigation by 5000 years ago. He claims that these emissions were sufficient to prevent a predicted start of reglaciation of northeastern Canada. Anthopogenic climate change was, therefore, beneficial for human society up till the start of the Industrial Revolution but is increasingly less so.

References

Arrhenius, Svante (1896) On the influence of carbonic acid in the air upon the temperature of the ground, Philosophical Magazine Series 5 41(April): 237-276.

Callendar, G. S. (1938) The artificial production of carbon dioxide and its influence on temperature, Quarterly Journal of the Royal Meteorological Society 64: 223-240.

Fourier, J. B. (1827) Memoire sur les temperatures du globe terrestre et des espaces plan- etaires, Mem. Acad. R. Sci. Inst. France 7: 569–604

Held, Isaac M. and Brian J. Soden (2000) Water Vapor Feedback And Global Warming, Annu. Rev. Energy Environ. 25: 441–475.

Keeling, C. D. (1960) The concentration and isotopic abundances of carbon dioxide in the atmosphere, Tellus 12(2): 200-203.

Keeling, C. D. (1973) Industrial production of carbon dioxide from fossil fuels and limestone, Tellus 25: 174-198. Cites = 209

Keeling, Charles D., Robert B. Bacastow, Arnold E. Bainbridge Carl A. Ekdahl, Peter R. Guenther, Lee S. Waterman, and John F. S. Chin (1976) Atmospheric carbon dioxide variations at Mauna Loa observatory, Hawaii, Tellus 28(6): 538-551. Cites = 442

Knutti, Reto & Gabriele C. Hegerl (2008) The equilibrium sensitivity of the Earth's temperature to radiation changes, Nature Geoscience 1: 735 – 743.

Kunnas, J. (2011) How to proceed after Copenhagen, Electronic Green Journal 1(31).

Plass, G. N. (1956a) The carbon dioxide theory of climatic change, Tellus 8(2): 140-154. Cites = 166

Plass, G. N. (1956b). Carbon Dioxide and the Climate, American Scientist (44): 302- 316.

Ruddiman, William F. (2003) The anthropogenic greenhouse era began thousands of years ago, Climatic Change 61(3): 261-293.

Tyndal J. (1861) On the absorption and radiation of heat by gases and vapours, and on the physical connexion of radiation, absorption, and conduction, Philos. Mag. 22: 169–94, 273–85

Capital Biased Technological Change

Another current debate is about the implications of capital biased technological change. It looks like there is going to be a series from Krugman on this. A previous blog by Krugman made the strange assumption that the capital stock was fixed. According to this blogpost, if you allow the capital stock to adjust workers are not made worse off in absolute terms by capital biased technological change though inequality rises assuming that some people mainly get labor income and some mainly capital income. Of course, it would make more sense to at least be using a constant elasticity of substitution production function with an elasticity of substitution that is different to one between capital and labor. You can't get biased technological change in a Cobb Douglas function without the ad hoc assumption that the elasticities change as the overall level of productivity goes up.

Saturday, December 29, 2012

Reading List on Trends, Drivers, and Forecasts of Greenhouse Gas Emissions etc.

Back in February I mentioned I was putting a review together on  drivers and trends of greenhouse gas emissions. In fact this is for one of those Edward Elgar collections of classic journal articles in a research area titled Climate Change and the World Economy. After a long break I am back working on it. The list is now a lot longer, thanks in part to some of the help I got then. Now I need to cut it down to about twenty key papers but I'll include some of the others in my discussion. Any suggestions are still welcome.

This is just 1/3 of the overall book. My coeditors are Frank Jotzo and Leo Dobes who will cover mitigation, impacts, and adaptation. Citation numbers are from Google Scholar.

Aldy, Joseph E. (2006) Per capita carbon dioxide emissions: convergence or divergence? Environmental and Resource Economics 33(4): 533-555. Citations = 87

Arrhenius, S. (1908) Worlds in the Making, Harper & Brothers, New York. Arrhenius, Svante (1896) On the influence of carbonic acid in the air upon the temperature of the ground, Philosophical Magazine Series 5 41 (April): 237-276. Cites = 1163

Ausubel, J. H. & W. D. Nordhaus (1983) A review of estimates of future carbon dioxide emissions, in T. F. Malone (ed.) Changing Climate: Report of the Carbon Dioxide Assessment Committee, National Academy Press, Washington DC. Chapter 2.2 pp153-185. Around 60 cites

Brock, William A. and M. Scott Taylor (2010) The green Solow model, Journal of Economic Growth 15:127–153. Citations: 218 including NBER Working Paper Brookes, L. (1990) The greenhouse effect: the fallacies in the energy efficiency solution, Energy Policy 18(2): 199-201. Cites = 141

Callendar, G. S. (1938) The artificial production of carbon dioxide and its influence on temperature, Quarterly Journal of the Royal Meteorological Society 64: 223-240. Cites = 387

Canadell, J. G., C. Le Quéré, M. R. Raupach, C. B. Field, E. T. Buitenhuis, P. Ciais, T. J. Conway, N. P. Gillett, R. A. Houghton, and G. Marland (2007) Contributions to accelerating atmospheric CO2 growth from economic activity, carbon intensity, and efficiency of natural sinks, Proceedings of the National Academy of Sciences 104(47): 18866–18870. Cites = 850

d'Arge, Ralph C., William D. Schulze, and David S. Brookshire (1982) Carbon dioxide and intergenerational choice, American Economic Review 72(2): 251-256. Cites = 76

d’Arge, R. C. et al. (1975) Economic and Social Measures of Biologic and Climatic Change, U.S. Department of Transportation.

Dietz, Thomas, and Eugene A. Rosa (1997) Effects of population and affluence on CO2 emissions, Proceedings of the National Academy of Sciences 94(1): 175 -179. Citations = 196

Edmonds, Jae and John Reilly (1983) Global energy and CO2 to the year 2050, The Energy Journal 4(3): 21-48. Cites = 113

Edmonds, Jae and John Reilly (1983) A long-term global energy-economic model of carbon dioxide release from fossil fuel use, Energy Economics 5(2): 74-88. Cites = 132

Ehrlich, P. R. and J. P. Holdren (1971) Impact of population growth, Science 171(3977): 1212-1217. Cites = 1094

Fonkych, Kateryna and Robert Lempert (2005) Assessment of Environmental Kuznets Curves and Socioeconomic Drivers in IPCC's SRES Scenarios, The Journal of Environment Development 14: 27-47. Cites = 13

Garnaut, Ross, Stephen Howes, Frank Jotzo, and Peter Sheehan (2008) Emissions in the Platinum Age: the implications of rapid development for climate-change mitigation, Oxford Review of Economic Policy 24(2): 377-401. Cites = 56

Grübler, Arnulf and Nebojsa Nakicénovic (1996) Decarbonizing the global energy system, Technological Forecasting and Social Change 53: 97-110. Cites = 56

Grübler, Arnulf, Nebojsa Nakicénovic, and David G. Victor (1999) Dynamics of energy technologies and global change, Energy Policy 27: 247-280. Cites = 409

Heil, M. T., & Selden, T. M. (2001). Carbon emissions and economic development: Future trajectories based on historical experience. Environment and Development Economics, 6, 63-83. Cites = 69

Henriques, Sofia Teives, and Astrid Kander (2010) The modest environmental relief resulting from the transition to a service economy, Ecological Economics 70(2): 271-282. Citations: 6

Holtz-Eakin, Douglas and Thomas M. Selden (1995) Stoking the fires? CO2 emissions and economic growth, Journal of Public Economics 57(1): 85-101. Cites = 710

Houghton, R. A. (1991) Tropical deforestation and atmospheric carbon dioxide, Climatic Change 19: 99-118. Cites = 291

Houghton, R. A. (2003) Revised estimates of the annual net flux of carbon to the atmosphere from changes in land use and land management 1850-2000, Tellus 55B: 378-390. Cites = 708

Keeling, C. D. (1973) Industrial production of carbon dioxide from fossil fuels and limestone, Tellus 25: 174-198. Cites = 209

Jotzo F., P. J. Burke, P. J. Wood, A. Macintosh, and D. I. Stern (2012) Decomposing the 2010 global carbon dioxide emissions rebound, Nature Climate Change 2(4), 213-214. Cites = 2

Kunnas, J. (2011) How to proceed after Copenhagen, Electronic Green Journal 1(31). Cites = 1

Leggett, J., W. J. Pepper, and R. J. Swart (1992) Emissions scenarios for the IPCC: an update, in: J. T. Houghton, B. A. Callander, and S. K. Varney (eds.) Climate Change 1992: The Supplementary Report to the IPCC Scientific Assessment, Cambridge University Press. Chapter A3, 69-96. Cites = 433

McKibbin, Warwick J., David Pearce, and Alison Stegman (2004) Can the IPCC SRES Be Improved? Energy and Environment 15(3): 351-362. Cites = 15

Morita, Tsuneyuki; Nebojsa Nakicenovic, and John Robinson (2000) Overview of mitigation scenarios for global climate stabilization based on new IPCC emission scenarios (SRES), Environmental Economics & Policy Studies 3(2): 65-88. Cites = 45

Munksgaard, Jesper and Klaus Alsted Pedersen (2001) CO2 accounts for open economies: producer or consumer responsibility? Energy Policy 29(4): 327–334. Cites = 263

Nakićenović, Nebojša (2000) Greenhouse gas emissions scenarios, Technological Forecasting and Social Change 65(2): 149–166. Cites = 40

Nakicenovic, Nebojsa et al. (2000) Special Report on Emissions Scenarios: A Special Report of Working Group III of the Intergovernmental Panel on Climate Change, Cambridge University Press. Cites = 2824

Nakicenovic, N., P. Kolp, K. Riahi, M. Kainuma, and T. Hansoka (2006) Assessment of emissions scenarios revisited, Environmental Economics and Policy Studies 7(3): 137-173. Cites = 39

Nakicenovic, Nebojsa, Nadejda Victor, and Tsuneyuki Morita (1998) Emissions scenarios database and review of scenarios, Mitigation and Adaptation Strategies for Global Change 3(2-4): 95-131. Cites = 46

Nordhaus, W. D. and G. W. Yohe (1983) Future paths of energy and carbon dioxide emissions, in T. F. Malone (ed.) Changing Climate: Report of the Carbon Dioxide Assessment Committee, National Academy Press, Washington DC. Chapter 2.1, pp87-152. Cites = 123

Pepper, W., J. Leggett, R. Swart, J. Wasson, J. Edmonds, and I. Mintzer (1992) Emissions scenarios for the IPCC. An update: assumptions, methodology and results, in Climate Change 1992: Supplementary Report to the IPCC Scientific Assessment, Cambridge University Press, Cambridge. Cites = 535

Penner, J. E., H. Eddleman, T. Novakov (1993) Towards the development of a global inventory for black carbon emissions, Atmospheric Environment 27A(8): 1277-1295. Cites = 265

Pepper, William, Wiley Barbour, Alexei Sankovski, and Barbara Braatz (1998) No-policy greenhouse gas emission scenarios: revisiting IPCC 1992, Environmental Science & Policy 1: 289-312. Cites =12

Perry, A. M., K. J. Araj, W. Fulkerson, D. J. Rose, M. M. Miller, and R. M. Rotty (1982) Energy supply and demand implications of CO2, Energy 7(12): 991-1004. Cites = 19.

Peters, Glen P. and Edgar G. Hertwich (2008) CO2 Embodied in International Trade with Implications for Global Climate Policy, Environmental Science and Technology 42(5): 1401-1407. Cites = 345

Plass, G. N. (1956) The carbon dioxide theory of climatic change, Tellus 8(2): 140-154. Cites = 166

Plassmann, Florenz and Neha Khanna (2006) Preferences, Technology, and the Environment: Understanding the Environmental Kuznets Curve Hypothesis, Amer. J. Agr. Econ. 88(3) (August 2006): 632–643. Cites = 23

Raupach, Michael R., Gregg Marland, Philippe Ciais, Corinne Le Quéré, Josep G. Canadell, Gernot Klepper, Christopher B. Field (2007) Global and regional drivers of accelerating CO2 emissions, Proceedings of the National Academy of Sciences 104(24): 10288-10293. Cites = 798

Revelle, R. & Suess, H. (1957). Carbon dioxide exchange between atmosphere and ocean, and the question of an increase of atmospheric CO2 during the past decade. Tellus 9(18), 18-27. Cites = 603

Riahi, Keywan, Arnulf Grübler, Nebojsa Nakicenovic (2007) Scenarios of long-term socio-economic and environmental development under climate stabilization, Technological Forecasting & Social Change 74: 887–935. Cites = 217

Ruddiman, William F. (2003) The anthropogenic greenhouse era began thousands of years ago, Climatic Change 61(3): 261-293. Cites = 522

Schmalensee, R., T. M. Stoker and R. A. Judson (1998), ‘World Carbon Dioxide Emissions: 1950-2050’, Review of Economics and Statistics, 80, 15-27. Cites = 373

Shafik N., Economic development and environmental quality: an econometric analysis, Oxford Economic Papers 46, 757-773 (1994). Cites = 828

Smith, S. J., H. Pitcher, and T. M. L. Wigley (2005) Future sulfur dioxide emissions, Climatic Change 73: 267-318. Cites = 39

Smith, S. J., J. van Ardenne, Z. Klimont, R. J. Andres, A. Volke, S. D. Arias (2011) Anthropogenic sulfur dioxide emissions: 1850-2005, Atmospheric Chemistry and Physics 11: 1101-1116. Cites = 47

Steinberger, Julia K., J. Timmons Roberts, Glen P. Peters, and Giovanni Baiocchi (2012) Pathways of human development and carbon emissions embodied in trade, Nature Climate Change 2: 81–85. Cites = 3

Stern D. I. (2006) Reversal in the trend of global anthropogenic sulfur emissions, Global Environmental Change 16(2), 207-220. Cites = 107

Stern D. I. (2010) Between estimates of the emissions-income elasticity, Ecological Economics 69, 2173-2182. Cites = 11 Stern D. I. and R. K. Kaufmann (1996) Estimates of global anthropogenic methane emissions 1860-1993, Chemosphere 33, 159-176. Cites = 66

Strazicich, Mark C. and John A. List (2003) Are CO2 emission levels converging among industrial countries? Environmental and Resource Economics 24(3): 263-271. Citations = 79

Streets, D. G., T. C. Bond, T. Lee, and C. Jang (2004) On the future of carbonaceous aerosol emissions, Journal of Geophysical Research 109: D24212. Cites = 93

van Vuuren, Detlef P., Jae Edmonds, Mikiko Kainuma, Keywan Riahi, Allison Thomson, Kathy Hibbard, George C. Hurtt, Tom Kram, Volker Krey, Jean-Francois Lamarque, Toshihiko Masui, Malte Meinshausen, Nebojsa Nakicenovic, Steven J. Smith, and Steven K. Rose (2011) The representative concentration pathways: an overview, Climatic Change 109(1-2): 5-31. Cites = 91

Vollebergh, Herman R.J., Bertrand Melenberg, and Elbert Dijkgraaf (2009) Identifying reduced-form relations with panel data: The case of pollution and income, Journal of Environmental Economics and Management 58(1): 27-42. Cites: 21

Wagner, M., 2008. The carbon Kuznets curve: A cloudy picture emitted by bad econometrics. Resource and Energy Economics 30, 388-408. Cites = 104

Westerlund, Joakim and Syed A. Basher (2008) Testing for convergence in carbon dioxide emissions using a century of panel data, Environmental and Resource Economics 40:109–120. Citations = 35

Yang, Christopher and Stephen H. Schneider (1998) Global carbon dioxide emissions scenarios: sensitivity to social and technological factors in three regions, Mitigation and Adaptation Strategies for Global Change 2: 373–404. Google = 34

Robert Gordon on Economic Growth

A recent working paper by Robert Gordon - Is U.S. Economic Growth Over? has been much discussed. Gordon argues that US growth has already slowed down and will slow further for various reasons including action on climate change. He describes the idea that rapid economic growth might be a once off event in human history as "audacious" (p2). But I think this is a commonplace idea in ecological economics. And slowing growth in the frontier countries is a common assumption in building business as usual scenarios for assessing climate change policies. On the other hand, it runs counter to the usual endogenous growth theory assumption that the rate of innovation continues to accelerate with growing world population. From this perspective it is a fairly radical idea that if true requires change to some theories.

Friday, December 21, 2012

Results from Stern (2012) Energy Economics Now on Data Page

The results data from my recent paper in Energy Economics are now up on my data page.

Data is presented in terms of distances and log distances relative to a stochastic frontier estimated with the between estimator for the 1971-2007 period. A distance of one (or log of zero) implies that a country is just on this frontier. But the frontier moves over time as world best practice improves. Countries can have time series values below zero (or a distance of less than one) because they may reach levels of energy efficiency greater than the the average best practice for the whole period. This is especially the case in the later years. The file also gives income per capita in PPP terms from the Penn World Table. Click here for more posts explaining this project.

Latest Crawford Research News

Sunday, December 16, 2012

Some Recent Literature on Journal Impact Factors

Following up on a post a few months ago here are some more comments on recent articles on journal impact factors:

Van Raan (2012) shows that there is a strong correlation (0.87) between the log of average citations per article for a research group and the average impact factor of the journals they publish in across 157 chemistry research groups in the Netherlands. But correlations are much lower between the citations to individual articles and the impact factors of the journals they publish in.

Vanclay (2012) strongly criticizes the impact factor in the lead paper in a special issue of Scientometrics on journal impact factors. In the opening paragraph he likens it to phrenology. Many of the remaining papers are invited responses including from Eugene Garfield (Pudovkin and Garfield, 2012) the originator of the impact factor and from David Pendlebury and Jonathan Adams at Thomson Reuters the current publishers of the Web of Science and the Journal Citation Reports (Pendlebury and Adams, 2012).

Vanclay does suggest that impact factors would be improved if confidence intervals were reported. Pudovkin and Garfield (2012) argue contrary to Vanclay (2012) that as the impact factor uses the full sample of data it has no attendant uncertainty in its calculation. But this depends on how we frame the question. If we model the number of citations that the articles published in a journal receive in a given subsequent year using a probability distribution, then the impact factor is simply an estimate of the expected value or first moment of the distribution. As an estimate of an unknown underlying parameter it is uncertain and an uncertainty measure should be reported. By contrast, Moed et al. (2012) “agree with Vanclay that ‘‘error bars’’ are urgently needed in journal metrics.” (372)

As for the nature of the citation distribution function, Stringer et al. (2008) show that the distribution of citations to papers published in a given year in a given journal is lognormal for papers cited at least one. A journal’s proportion of uncited papers is tightly negatively correlated with the mean of its log citations. Though other distributions also fit the data well (e.g. Glänzel et al., 2009), publishing the mean of log citations, the standard deviation, and the uncited fraction would be very informative.

References:

Glänzel, W. (2009) The multi-dimensionality of journal impact, Scientometrics 78(2): 355-374.

Moed, H. F., L. Colledge, J., Reedijk, F. Moya-Anegon, V. Guerrero-Bote, A. Plume, and M. Amin (2012) Citation-based metrics are appropriate tools in journal assessment provided that they are accurate and used in an informed way, Scientometrics 92: 367-376.

Pendlebury, D. A. and J. Adams (2012) Comment on a critique of the Thomson Reuters journal impact factor, Scientometrics 92: 395-401.

Pudovkin, A. I. and E. Garfield (2012) Rank normalizartion of impact factors will resolve Vanclay’s dilemma with TRIF: Comments on the paper by Jerome Vanclay, Scientometrics 92: 409-412.

Stringer, M. J., M. Sales-Pardo, L. A. Nunes Amaral (2008) Effectiveness of journal ranking schemes as a tool for locating information, PLoS One 3(2): e1683.

van Raan, A. F. J. (2012) Properties of journal impact in relation to bibliometric research group performance indicators, Scientometrics 92: 457-469.

Vanclay, J. K. (2012) Impact factor: Outdated artefact or stepping-stone to journal certification, Scientometrics 92: 211-238.

Thursday, December 13, 2012

Doha Outcomes


The main outcomes of the Doha COP meeting that recently concluded were a potentially expanded commitment on financial transfers from developed to developing countries and the renewal of the Kyoto Treaty.

On the Kyoto Treaty I have seen no discussion in the media of the actual commitments participants have agreed to. It turns out that countries have simply used their Copenhagen commitments. So Australia will reduce emissions by 5% from 1990 levels and the EU, 20%. Now these are internationally legally binding commitments. Of course, the total emissions of these countries are only 15% of global emissions. The US never ratified Kyoto and Canada and Japan will not join in the next period. Supposedly, a new treaty is coming in 2015...

There has been much talk in the Australian media and particularly in The Australian about the financing commitment. The latter newspaper derived their numbers from a paper put out by Frank Jotzo but it seems to be used rather out of context. Frank has an op-ed out putting it all into context again.

Strength of the Go8

The Group of Eight are Australia's equivalent to the US R1 (or RU/VH in current terminology) universities. They are a self-nominating group but their research performance does stand out relative to the rest of the sector as shown in this graphic:

The Group of Eight are listed in the first eight columns and the other universities in the remaining ones. Each coloured square indicates a discipline at a university which was rated 4 or 5 (i.e. above world standard) in ERA 2012. The divide between the Go8 and the other universities is clearer in the social sciences and humanities fields such as economics (only one other university has a 4 or 5), business (none).

A similar pattern exists for research funding.

Tuesday, December 11, 2012

Bob Costanza Appointed to Chair in Public Policy at Crawford School


I previously blogged about Bob Costanza and Ida Kubiszewski visiting the Crawford School from August to the end of this year. Now I'm happy to let you know that they're staying. Bob was appointed to one of the Vice-Chancellor's chairs of Public Policy at Crawford. The first such appointee was Warwick McKibbin. Ida will be a senior lecturer in Crawford.

Thursday, December 6, 2012

Average Number of Authors by Discipline

There is lots of interesting information in the ERA 2012 report. One item of interest to an audience beyond Australia is the average number of authors per publication:


I was surprised that astronomy was highest rather than physics. But I guess not all physics involves particle accelerators :)

ANU Gets a 5 in Economics

The ERA 2012 results are out this morning. ANU got a 5 in economics compared to a 4 in ERA 2010. We got a 5 in econometrics and 4 in applied economics and economic theory. The econometrics score is improved on last time too and I predicted that we would get a 5 in econometrics though I didn't see us improving our overall score for economics. However, the ARC evaluate two digit fields like economics (14) separately from 4 digit fields like applied economics (1402). Different outside reviewers receive a different sample of publications to evaluate. The two digit score is not a weighted mean of the four digit scores.

Melbourne got three 5's and a 4 in applied econ (nobody submitted anything in 1499 "other economics" this time). Monash got a 5 for 14 and econometrics (1403) and a 4 for 1402 and didn't submit in economic theory (1401). UTS got three 5's - it also didn't submit in 1401. UQ got  5 in 1401 and 4's otherwise. That's it for the 5's. Full details are in the table below. Click on it to enlarge.


In other major disciplines of interest to the Crawford School we got a 5 in political science, 3 in policy and administration, 5 in environmental science and management, and 5 in anthropology.

Tuesday, December 4, 2012

Posts on 2012 MAER Colloquium

Margaret Giles and Tom Stanley have both posted some information and links about the recent MAER Colloquium in Perth. I'm the tall guy in the middle of the back row. The next colloquium will be in London. Greenwich to be exact. Organized by Mehmet Ugur.