
Saturday, December 29, 2012
Robert Gordon on Economic Growth


Friday, December 21, 2012
Results from Stern (2012) Energy Economics Now on Data Page
The results data from my recent paper in Energy Economics are now up on my data page.
Data is presented in terms of distances and log distances relative to a stochastic frontier estimated with the between estimator for the 1971-2007 period. A distance of one (or log of zero) implies that a country is just on this frontier. But the frontier moves over time as world best practice improves. Countries can have time series values below zero (or a distance of less than one) because they may reach levels of energy efficiency greater than the the average best practice for the whole period. This is especially the case in the later years. The file also gives income per capita in PPP terms from the Penn World Table. Click here for more posts explaining this project.
Data is presented in terms of distances and log distances relative to a stochastic frontier estimated with the between estimator for the 1971-2007 period. A distance of one (or log of zero) implies that a country is just on this frontier. But the frontier moves over time as world best practice improves. Countries can have time series values below zero (or a distance of less than one) because they may reach levels of energy efficiency greater than the the average best practice for the whole period. This is especially the case in the later years. The file also gives income per capita in PPP terms from the Penn World Table. Click here for more posts explaining this project.
Sunday, December 16, 2012
Some Recent Literature on Journal Impact Factors
Following up on a post a few months ago here are some more comments on recent articles on journal impact factors:
Van Raan (2012) shows that there is a strong correlation (0.87) between the log of average citations per article for a research group and the average impact factor of the journals they publish in across 157 chemistry research groups in the Netherlands. But correlations are much lower between the citations to individual articles and the impact factors of the journals they publish in.
Vanclay (2012) strongly criticizes the impact factor in the lead paper in a special issue of Scientometrics on journal impact factors. In the opening paragraph he likens it to phrenology. Many of the remaining papers are invited responses including from Eugene Garfield (Pudovkin and Garfield, 2012) the originator of the impact factor and from David Pendlebury and Jonathan Adams at Thomson Reuters the current publishers of the Web of Science and the Journal Citation Reports (Pendlebury and Adams, 2012).
Vanclay does suggest that impact factors would be improved if confidence intervals were reported. Pudovkin and Garfield (2012) argue contrary to Vanclay (2012) that as the impact factor uses the full sample of data it has no attendant uncertainty in its calculation. But this depends on how we frame the question. If we model the number of citations that the articles published in a journal receive in a given subsequent year using a probability distribution, then the impact factor is simply an estimate of the expected value or first moment of the distribution. As an estimate of an unknown underlying parameter it is uncertain and an uncertainty measure should be reported. By contrast, Moed et al. (2012) “agree with Vanclay that ‘‘error bars’’ are urgently needed in journal metrics.” (372)
As for the nature of the citation distribution function, Stringer et al. (2008) show that the distribution of citations to papers published in a given year in a given journal is lognormal for papers cited at least one. A journal’s proportion of uncited papers is tightly negatively correlated with the mean of its log citations. Though other distributions also fit the data well (e.g. Glänzel et al., 2009), publishing the mean of log citations, the standard deviation, and the uncited fraction would be very informative.
References:
Glänzel, W. (2009) The multi-dimensionality of journal impact, Scientometrics 78(2): 355-374.
Moed, H. F., L. Colledge, J., Reedijk, F. Moya-Anegon, V. Guerrero-Bote, A. Plume, and M. Amin (2012) Citation-based metrics are appropriate tools in journal assessment provided that they are accurate and used in an informed way, Scientometrics 92: 367-376.
Pendlebury, D. A. and J. Adams (2012) Comment on a critique of the Thomson Reuters journal impact factor, Scientometrics 92: 395-401.
Pudovkin, A. I. and E. Garfield (2012) Rank normalizartion of impact factors will resolve Vanclay’s dilemma with TRIF: Comments on the paper by Jerome Vanclay, Scientometrics 92: 409-412.
Stringer, M. J., M. Sales-Pardo, L. A. Nunes Amaral (2008) Effectiveness of journal ranking schemes as a tool for locating information, PLoS One 3(2): e1683.
van Raan, A. F. J. (2012) Properties of journal impact in relation to bibliometric research group performance indicators, Scientometrics 92: 457-469.
Vanclay, J. K. (2012) Impact factor: Outdated artefact or stepping-stone to journal certification, Scientometrics 92: 211-238.
Van Raan (2012) shows that there is a strong correlation (0.87) between the log of average citations per article for a research group and the average impact factor of the journals they publish in across 157 chemistry research groups in the Netherlands. But correlations are much lower between the citations to individual articles and the impact factors of the journals they publish in.
Vanclay (2012) strongly criticizes the impact factor in the lead paper in a special issue of Scientometrics on journal impact factors. In the opening paragraph he likens it to phrenology. Many of the remaining papers are invited responses including from Eugene Garfield (Pudovkin and Garfield, 2012) the originator of the impact factor and from David Pendlebury and Jonathan Adams at Thomson Reuters the current publishers of the Web of Science and the Journal Citation Reports (Pendlebury and Adams, 2012).
Vanclay does suggest that impact factors would be improved if confidence intervals were reported. Pudovkin and Garfield (2012) argue contrary to Vanclay (2012) that as the impact factor uses the full sample of data it has no attendant uncertainty in its calculation. But this depends on how we frame the question. If we model the number of citations that the articles published in a journal receive in a given subsequent year using a probability distribution, then the impact factor is simply an estimate of the expected value or first moment of the distribution. As an estimate of an unknown underlying parameter it is uncertain and an uncertainty measure should be reported. By contrast, Moed et al. (2012) “agree with Vanclay that ‘‘error bars’’ are urgently needed in journal metrics.” (372)
As for the nature of the citation distribution function, Stringer et al. (2008) show that the distribution of citations to papers published in a given year in a given journal is lognormal for papers cited at least one. A journal’s proportion of uncited papers is tightly negatively correlated with the mean of its log citations. Though other distributions also fit the data well (e.g. Glänzel et al., 2009), publishing the mean of log citations, the standard deviation, and the uncited fraction would be very informative.
References:
Glänzel, W. (2009) The multi-dimensionality of journal impact, Scientometrics 78(2): 355-374.
Moed, H. F., L. Colledge, J., Reedijk, F. Moya-Anegon, V. Guerrero-Bote, A. Plume, and M. Amin (2012) Citation-based metrics are appropriate tools in journal assessment provided that they are accurate and used in an informed way, Scientometrics 92: 367-376.
Pendlebury, D. A. and J. Adams (2012) Comment on a critique of the Thomson Reuters journal impact factor, Scientometrics 92: 395-401.
Pudovkin, A. I. and E. Garfield (2012) Rank normalizartion of impact factors will resolve Vanclay’s dilemma with TRIF: Comments on the paper by Jerome Vanclay, Scientometrics 92: 409-412.
Stringer, M. J., M. Sales-Pardo, L. A. Nunes Amaral (2008) Effectiveness of journal ranking schemes as a tool for locating information, PLoS One 3(2): e1683.
van Raan, A. F. J. (2012) Properties of journal impact in relation to bibliometric research group performance indicators, Scientometrics 92: 457-469.
Vanclay, J. K. (2012) Impact factor: Outdated artefact or stepping-stone to journal certification, Scientometrics 92: 211-238.
Thursday, December 13, 2012
Doha Outcomes

The main outcomes of the Doha COP meeting that recently concluded were a potentially expanded commitment on financial transfers from developed to developing countries and the renewal of the Kyoto Treaty.
On the Kyoto Treaty I have seen no discussion in the media of the actual commitments participants have agreed to. It turns out that countries have simply used their Copenhagen commitments. So Australia will reduce emissions by 5% from 1990 levels and the EU, 20%. Now these are internationally legally binding commitments. Of course, the total emissions of these countries are only 15% of global emissions. The US never ratified Kyoto and Canada and Japan will not join in the next period. Supposedly, a new treaty is coming in 2015...
There has been much talk in the Australian media and particularly in The Australian about the financing commitment. The latter newspaper derived their numbers from a paper put out by Frank Jotzo but it seems to be used rather out of context. Frank has an op-ed out putting it all into context again.
On the Kyoto Treaty I have seen no discussion in the media of the actual commitments participants have agreed to. It turns out that countries have simply used their Copenhagen commitments. So Australia will reduce emissions by 5% from 1990 levels and the EU, 20%. Now these are internationally legally binding commitments. Of course, the total emissions of these countries are only 15% of global emissions. The US never ratified Kyoto and Canada and Japan will not join in the next period. Supposedly, a new treaty is coming in 2015...
There has been much talk in the Australian media and particularly in The Australian about the financing commitment. The latter newspaper derived their numbers from a paper put out by Frank Jotzo but it seems to be used rather out of context. Frank has an op-ed out putting it all into context again.
Strength of the Go8
The Group of Eight are Australia's equivalent to the US R1 (or RU/VH in current terminology) universities. They are a self-nominating group but their research performance does stand out relative to the rest of the sector as shown in this graphic:

A similar pattern exists for research funding.
Tuesday, December 11, 2012
Bob Costanza Appointed to Chair in Public Policy at Crawford School

Thursday, December 6, 2012
Average Number of Authors by Discipline
There is lots of interesting information in the ERA 2012 report. One item of interest to an audience beyond Australia is the average number of authors per publication:

I was surprised that astronomy was highest rather than physics. But I guess not all physics involves particle accelerators :)

I was surprised that astronomy was highest rather than physics. But I guess not all physics involves particle accelerators :)
ANU Gets a 5 in Economics
The ERA 2012 results are out this morning. ANU got a 5 in economics compared to a 4 in ERA 2010. We got a 5 in econometrics and 4 in applied economics and economic theory. The econometrics score is improved on last time too and I predicted that we would get a 5 in econometrics though I didn't see us improving our overall score for economics. However, the ARC evaluate two digit fields like economics (14) separately from 4 digit fields like applied economics (1402). Different outside reviewers receive a different sample of publications to evaluate. The two digit score is not a weighted mean of the four digit scores.
Melbourne got three 5's and a 4 in applied econ (nobody submitted anything in 1499 "other economics" this time). Monash got a 5 for 14 and econometrics (1403) and a 4 for 1402 and didn't submit in economic theory (1401). UTS got three 5's - it also didn't submit in 1401. UQ got 5 in 1401 and 4's otherwise. That's it for the 5's. Full details are in the table below. Click on it to enlarge.
Melbourne got three 5's and a 4 in applied econ (nobody submitted anything in 1499 "other economics" this time). Monash got a 5 for 14 and econometrics (1403) and a 4 for 1402 and didn't submit in economic theory (1401). UTS got three 5's - it also didn't submit in 1401. UQ got 5 in 1401 and 4's otherwise. That's it for the 5's. Full details are in the table below. Click on it to enlarge.

In other major disciplines of interest to the Crawford School we got a 5 in political science, 3 in policy and administration, 5 in environmental science and management, and 5 in anthropology.
Tuesday, December 4, 2012
Posts on 2012 MAER Colloquium

Wednesday, November 28, 2012
Information for Prospective PhD Students
In the US, a proposal is not a requirement for applying to do a PhD. Usually, students do one to two years of coursework before writing their proposal and it is enough to confirm that a department has faculty specializing in the general area that a student is interested in, say energy economics or climate change in my case. But, here in Australia, we expect students to submit a detailed proposal, even though in practice this proposal will be extensively revised after they start study. And in our economics program there is a year of coursework before students switch to research only. It makes sense to me for a student to select an area of interest to the potential supervisor and then discuss with the supervisor how to develop the proposal. Of course, a student might have a burning issue that they can't wait to conduct research on. But I doubt there are really many such cases. I certainly didn't know what I wanted to research. This was one of the main reasons I went to study in the US rather than remain in the UK. In the UK I would have needed to submit a proposal with my application.
Jack Pezzey has some good guidelines to help potential PhD students think about the application process in Australia. He recommends developing the proposal in consultation with him. He also has a great summary of his current research interests. That was meant to be one of the purposes of this blog. I used to have a research page on my website. But I scrapped that when I started this blog. I've decided it's time to put up a research page again. I hope this will be useful to give potential PhD students and collaborators an idea of what I am currently working on or would be interested in working.
Some previous thoughts on PhD applications.
Jack Pezzey has some good guidelines to help potential PhD students think about the application process in Australia. He recommends developing the proposal in consultation with him. He also has a great summary of his current research interests. That was meant to be one of the purposes of this blog. I used to have a research page on my website. But I scrapped that when I started this blog. I've decided it's time to put up a research page again. I hope this will be useful to give potential PhD students and collaborators an idea of what I am currently working on or would be interested in working.
Some previous thoughts on PhD applications.
World Energy Outlook 2012 and the Rebound Effect
I have been reading the 2012 World Energy Outlook from the IEA. There is a special focus section of three chapters on the role that energy efficiency improvements could play in reducing greenhouse gas emissions. The report is generally very conservative on estimated uptake of alternative energy and, therefore, efficiency will be needed if there is to be any chance of staying within a 2C trajectory.
There is, however, only one mention of the rebound effect in this whole section in Box 10.2 on p316. Somehow they come up with an estimated rebound effect of only 9%. This is almost certainly an underestimate of the rebound effect. Typical estimates for direct rebound in consumer applications are around 30%, while on the production side and at the macro-level rebound effects can be much larger than this. The report does correctly note that:
"A significant portion of this could avoided by appropriate pricing policy"
A cap on carbon emissions will induce energy efficiency improvements as part of the solution. Though there will still be a rebound effect it can't result in the emissions reduction goal not being met. However, an efficiency policy without a carbon cap is likely to yield disappointing results in my opinion. With a carbon tax, rebound means that the carbon tax would have to be higher than it would be if there was no rebound, I think.
There is, however, only one mention of the rebound effect in this whole section in Box 10.2 on p316. Somehow they come up with an estimated rebound effect of only 9%. This is almost certainly an underestimate of the rebound effect. Typical estimates for direct rebound in consumer applications are around 30%, while on the production side and at the macro-level rebound effects can be much larger than this. The report does correctly note that:
"A significant portion of this could avoided by appropriate pricing policy"
A cap on carbon emissions will induce energy efficiency improvements as part of the solution. Though there will still be a rebound effect it can't result in the emissions reduction goal not being met. However, an efficiency policy without a carbon cap is likely to yield disappointing results in my opinion. With a carbon tax, rebound means that the carbon tax would have to be higher than it would be if there was no rebound, I think.
Wednesday, November 21, 2012
Being on the Cutting Edge
I was just reading another essay by Paul Graham, which I thought was worth linking. A lot of this is true for academic research too. The best way to get lots of good research ideas is to put yourself at the cutting edge. Doing research on any idea you have should lead to more ideas. Having a prepared mind is important. Studying and doing research prepares your mind. A short-cut is to put yourself in an environment where there are people at the cutting edge. This is why it is important to go to a good place to do graduate study etc. Going to conferences and seminars even not in what you think is your area. Something a lot of grad students don't do, but the successful ones do.
Eventually, you'll find you have so many ideas you have to pick and choose and prioritize between them. Having ideas will no longer be the problem, bringing them to fruition will be. That's when you'll start getting other people to work on them for you :)
Eventually, you'll find you have so many ideas you have to pick and choose and prioritize between them. Having ideas will no longer be the problem, bringing them to fruition will be. That's when you'll start getting other people to work on them for you :)
Update
I haven't posted so far this month. I have been travelling. First I was at the IPCC Working Group 3 meeting in Vigo, Spain. Then I was in Vienna where I gave a presentation on trends, drivers, and mitigation of climate change at W.U.. Now I am in Israel visiting family. Just coincided with kind of a war going on... Early tomorrow morning I start the long trip back to Australia.
Wednesday, October 31, 2012
PLoS ONE: SNIP2 vs. SJR2
I know a lot of my readers arrive via searches for information on PLoS ONE. So as a follow up on my post on SNIP and SJR here is the data for PLoS ONE:

Two things stand out: First, the journal gets cited in strong citing journals as its SJR is relatively higher than its SNIP. Second, like the Article Influence and Impact Factor, SJR falls in 2011 vs. 2010 though SNIP is flat.

Two things stand out: First, the journal gets cited in strong citing journals as its SJR is relatively higher than its SNIP. Second, like the Article Influence and Impact Factor, SJR falls in 2011 vs. 2010 though SNIP is flat.
SNIP2 vs. SJR2
Following up from Monday's post on SNIP2 and SJR2. I finally got a copy of the full database. 16866 journals have both a non-zero SNIP and a non-zero SJR for 2011. It's hard to understand how a journal could have a positive SJR but a zero SNIP, but there are a lot of such journals. There are a total of 32060 journals in the database. I plotted the two indicators for the subsample of journals against each other:
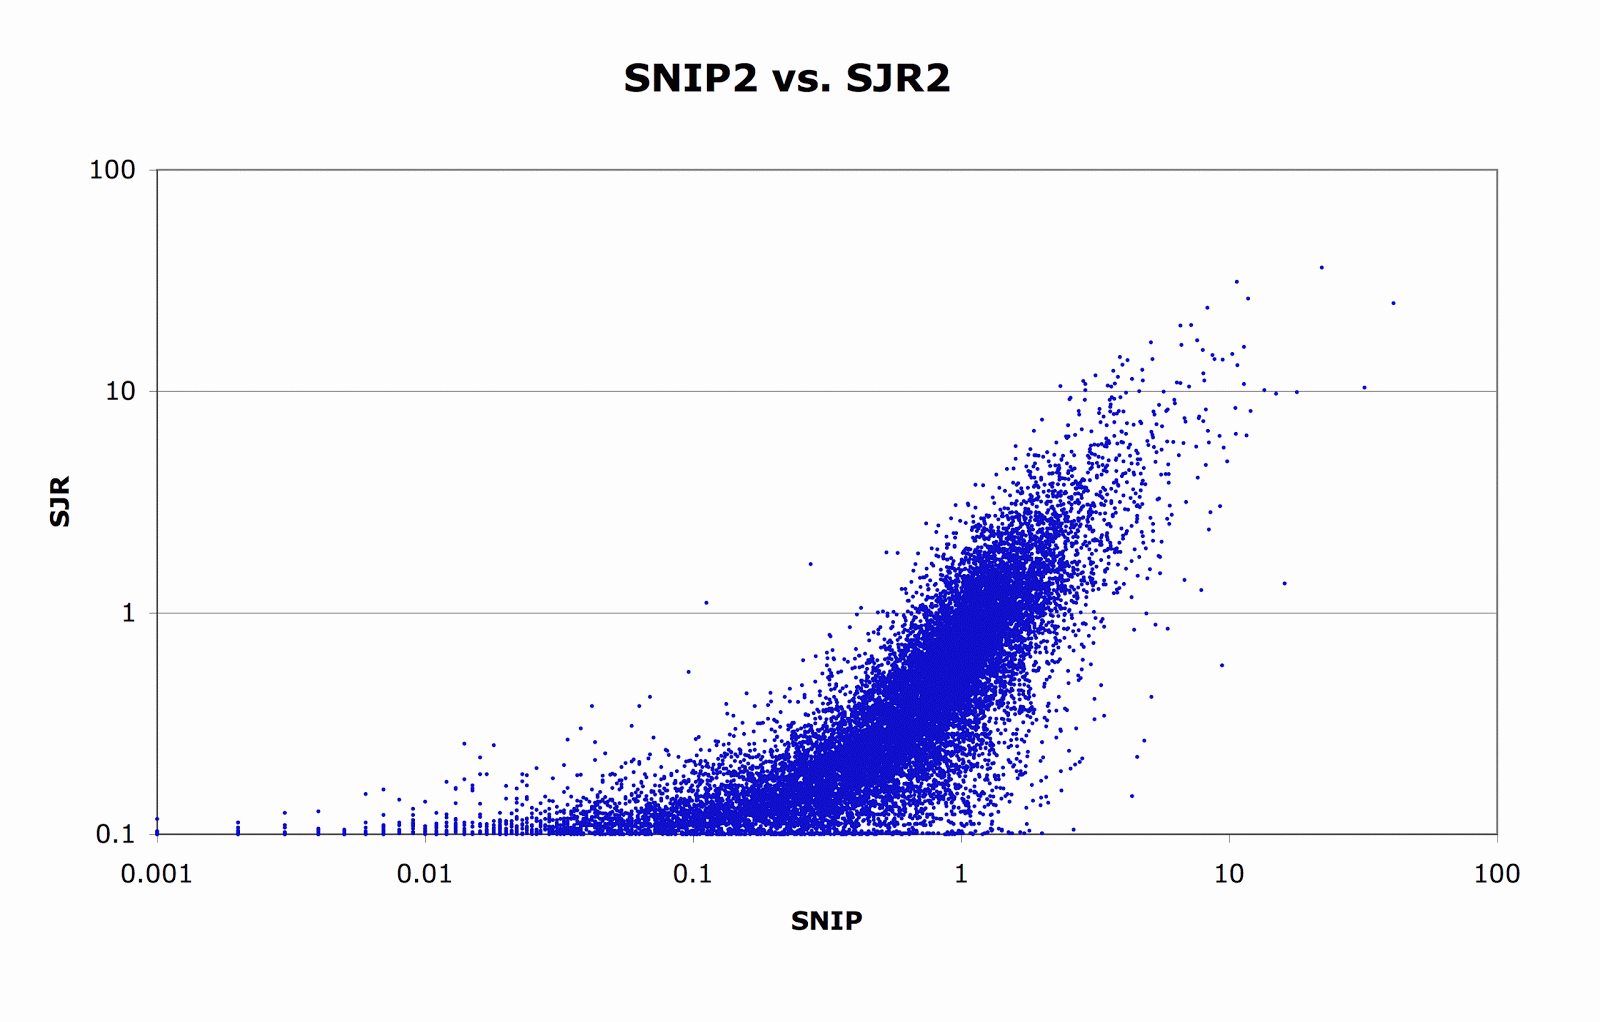
The relationship is pretty linear in log-log space except that SJR is truncated at 0.1. The correlation between the two series is 0.75 (0.77 for the log series).
There are 646 economics, econometrics, and finance journals that have a non-zero SNIP and SJR. Here is the scatterplot for the two indicators for this sample:

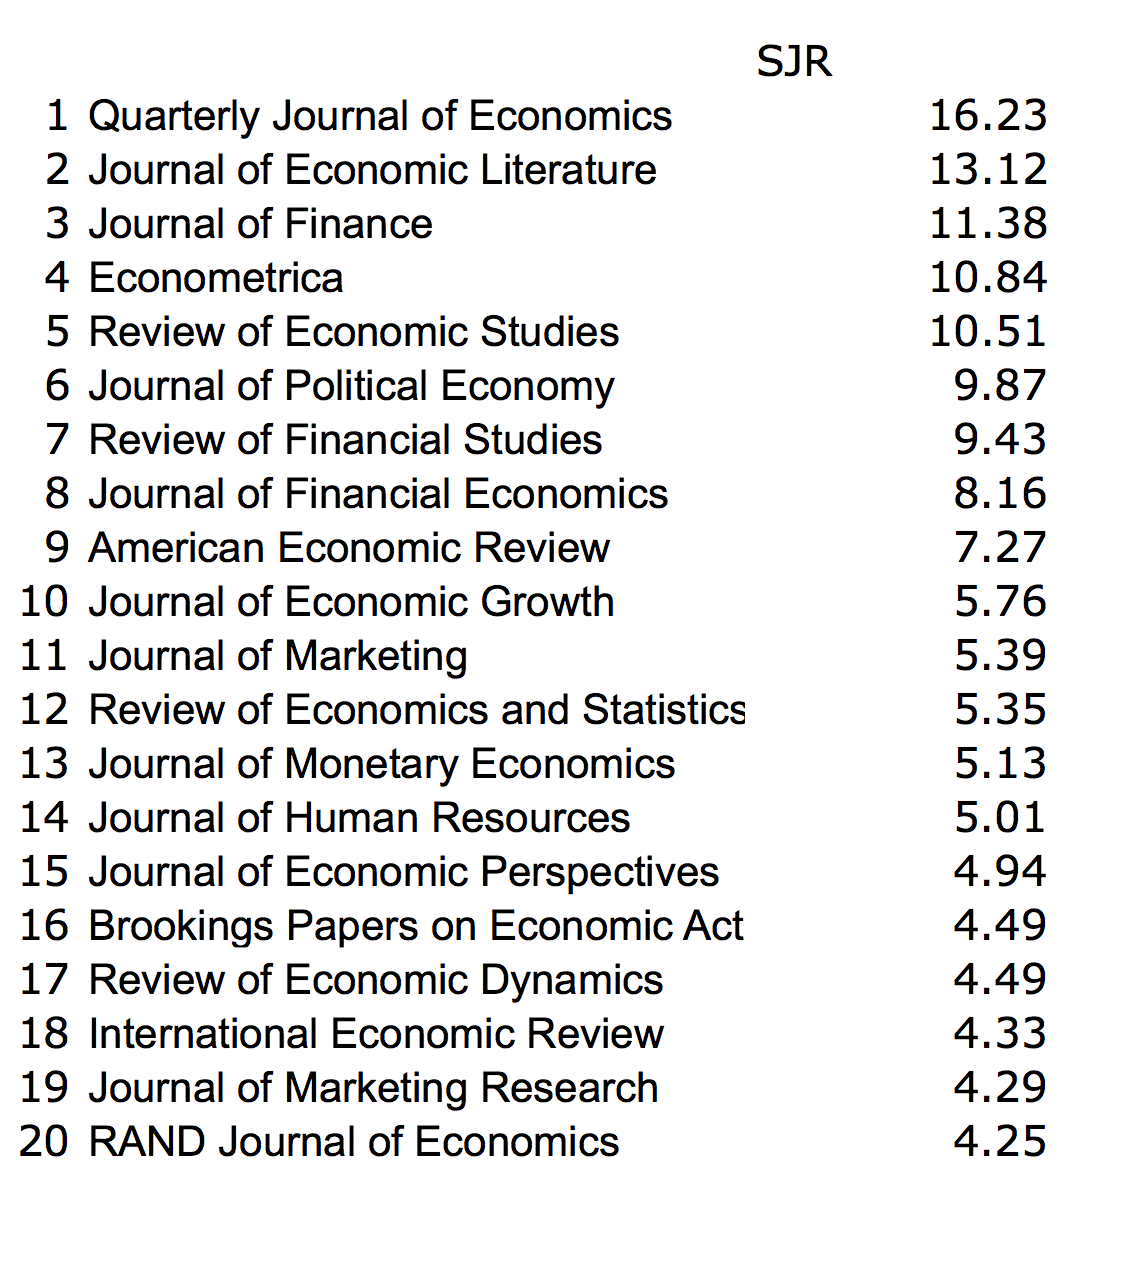
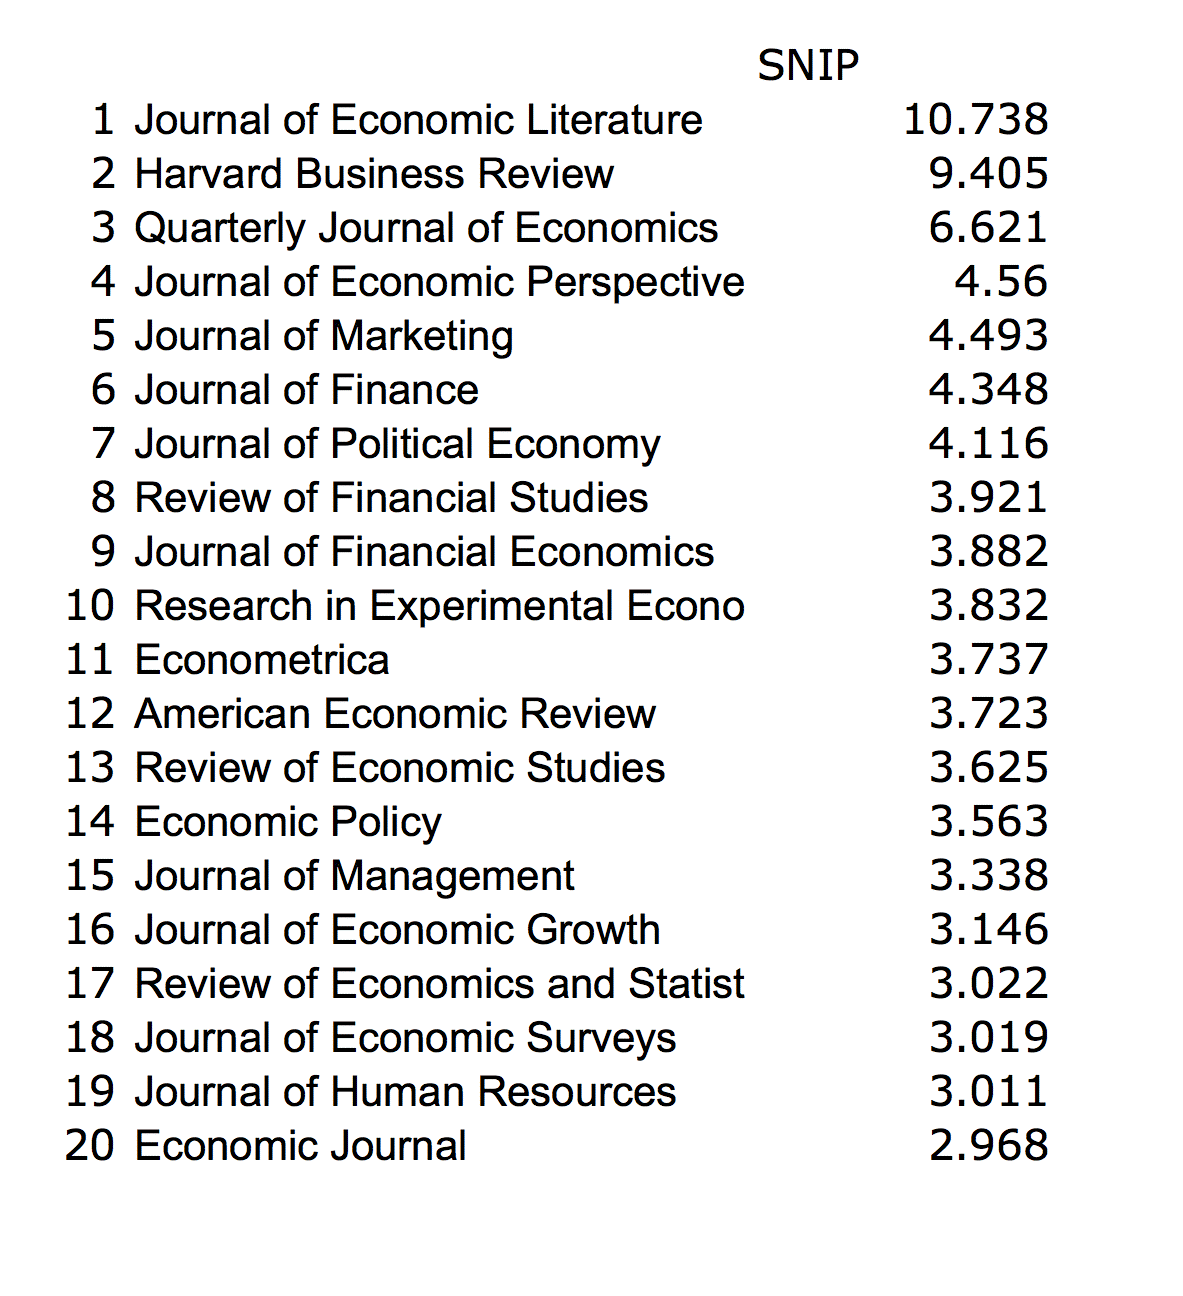
It looks very similar to the data for the full sample. So, it doesn't seem that there is a big difference between using one indicator or the other. Looking at the top 20 journals in economics and finance according to SJR, we have:
Monday, October 29, 2012
SNIP2
Elsevier has released it's latest journal impact factors - SNIP and SJR - and announcing some changes in the way they are calculated. They are now called SNIP2 and SJR2. SNIP stands for Source Normalized Impact per Paper and takes into account that citation practices vary across fields and the possibility to get cited is higher in some fields and lower than others. However, instead assigning each article to a field the adjustments are based on the length of reference lists in articles citing the journal in question and what share of those citations the journal in question has. SNIP2 makes some adjustments to reduce the effect of outliers and now the average SNIP will be 1 as will the average SJR. SJR is a recursive indicator similar to Article Influence or PageRank. Previously SJR strongly favored natural science journals and biomedical journals in particular. In other words, it wasn't source normalized. A first glance at the new numbers shows that SNIP doesn't look a lot different before, but that SJR numbers are now in similar ranges to SNIP.
At Crawford we are planning to allocate internal research funds awarded according to publication quantity and quality using SNIP to weight journal articles. It looks like the new metric will be just as suitable. We'll need more experience to see if SJR2 is superior to SNIP.
At Crawford we are planning to allocate internal research funds awarded according to publication quantity and quality using SNIP to weight journal articles. It looks like the new metric will be just as suitable. We'll need more experience to see if SJR2 is superior to SNIP.
Monday, October 22, 2012
MYEFO Update
The Australian federal mid-year mini-budget was released this morning. The ARC pause on funding has been released and the Linkage program opened for applications. However, the SRE component "research quantum" will be cut relative to a projected inscrease as will so called facilitation funds. The research quantum are government funds for research provided to the universities partly based on their research performance that are similar to the overhead component in US grants. When you submit a grant application to the ARC here in Australia you do not include overheads in your proposal. This doesn't mean that the university doesn't earn overhead on successful grants. It's just done indirectly with a time lag. This is somewhat good news as the cuts are smaller than rumored and don't affect individuals applying for grants.
In total these cuts are estimated to cost ANU at least $3.4 million in 2013 and $8.1 million in 2014.
More from The Australian here.
In total these cuts are estimated to cost ANU at least $3.4 million in 2013 and $8.1 million in 2014.
More from The Australian here.
Saturday, October 20, 2012
ORCID is Now Open for Registration
I wrote about ORCID - a global system of free unique researcher IDs - more than a year ago. You can finally now register for ORCID and I just signed up and linked my data from my Scopus profile. Actually, it was Scopus' home page that alerted me to the possibility of getting an ORCID ID. Hopefully, this will really take off and allow the easy identification of researchers and their track records. Especially, those with common names like S. Liu or D. Stern.*
* D. I. Stern is a unique academic name but not all my publications or citations have both initials and David and Daniel Stern are very common names. This non-academic David I. Stern is pretty prominent too and I did find one David Ian Stern in Texas.
* D. I. Stern is a unique academic name but not all my publications or citations have both initials and David and Daniel Stern are very common names. This non-academic David I. Stern is pretty prominent too and I did find one David Ian Stern in Texas.
Friday, October 19, 2012
Journal Page Numbers are Disappearing
The UK-based Royal Society is dropping page numbers from its journal articles as it goes to the continuous publication model. This includes some of the oldest academic journals in existence.
I expect this trend to spread across academic publishing. The current situation with articles languishing in "online first" or "Articles in press" sections of journals for months or years (as in the example of my recent paper in Journal of Economic Surveys) before being included in a formal journal issue and being given a full citation is silly. I've read that journals do this to try to game citation impact factors, but I'm skeptical of that. It seems just to be conservatism to stick to the print production model when most access is now online.
Of course, some journals like Journal of Geophysical Research have been publishing articles with just article identifiers for more than a decade now and others like PLoS ONE started as pure online journals without page numbers.
I expect this trend to spread across academic publishing. The current situation with articles languishing in "online first" or "Articles in press" sections of journals for months or years (as in the example of my recent paper in Journal of Economic Surveys) before being included in a formal journal issue and being given a full citation is silly. I've read that journals do this to try to game citation impact factors, but I'm skeptical of that. It seems just to be conservatism to stick to the print production model when most access is now online.
Of course, some journals like Journal of Geophysical Research have been publishing articles with just article identifiers for more than a decade now and others like PLoS ONE started as pure online journals without page numbers.
Thursday, October 18, 2012
ARC Funding Freeze
There has been a lot of uncertainty recently about what is happening with research funding in Australia. There have been no announcements on when the next application rounds will open and around now the results of the ARC Discovery grant applications from earlier this year for funding next year should have been announced. The federal government has promised to deliver a budget surplus and was rumoured to be looking at cutting anything they could to achieve the goal. We got some information yesterday at a Senate hearing, where the ARC CEO - former ANU Dean of Science Aiden Byrne - and the minister both were questioned. We were told that there has been a funding freeze in place since August. It looks like that we might have more certainty after MYEFO or "minibudget", which will be released on Monday. But it also looks like that not as much funding will be available in the near future as there has been in the recent past.
Friday, October 12, 2012
Per Capita Energy Use in the UK

The history of energy use per capita is quite different in the UK compared to other developed countries. Already by 1800 about 3/4 of UK energy use was coal as the UK was the first country to industrialize. Energy use per capita peaks before the First World War and never really "recovers". In most other countries there was a very strong growth of energy use between the end of the Second World War and the oil price shocks in the 1970s.
This data is a rough estimate of "final energy use". The energy in electricity consumed is included in the data and the energy used to produce the electricity is deducted. Currently, electricity generation is about 40% efficient in the UK, meaning that 60% of the energy used to generate electricity is lost as waste heat. There are also about 7% losses of electricity in the transmission and distribution system.
This data is a rough estimate of "final energy use". The energy in electricity consumed is included in the data and the energy used to produce the electricity is deducted. Currently, electricity generation is about 40% efficient in the UK, meaning that 60% of the energy used to generate electricity is lost as waste heat. There are also about 7% losses of electricity in the transmission and distribution system.
Thursday, October 11, 2012
Energy Cost Share for England and Wales
Astrid Kander is visiting me to work on our ARC project. One paper we are working on is a comparison of Sweden and the United Kingdom. One of the our stylized facts on the relationship between energy and growth is that the share of energy in total production cost declines over time. This is very clear in the data from Sweden. But up till now, we've had very limited evidence for other countries. So we are putting together a comparable data set for England and Wales. The results are quite similar though less dramatic:
 There are quite a lot of "kinks" in this data to be ironed out still, so this is very preliminary. We plan to fit the same model as we fitted to the Swedish data in our Energy Journal paper to this data too and then compare the results.

Tuesday, October 2, 2012
2012 US EIA Annual Energy Review
The EIA's Annual Energy Review was published a few days ago. This is a fantastic "one stop shop" overview of US energy data. The graphics are particularly good. However, like last year's report it is only US data. From last year, the AER dropped coverage of international data, though the EIA website still provides access to it.
Monday, October 1, 2012
Job Opportunity with the ICRC
Jack Gregory, who did a master research essay with me, which we now turned into this working paper, asked me to help find someone for this position:
We are currently looking for a recent grad to join the team at the Independent Competition and Regulatory Commission (the Commission):
The Commission is a statutory body set up to regulate prices, access to infrastructure services and other matters in relation to regulated industries (incl. water and electricity). Essentially, we are the economic regulator for the ACT.
Regarding the position, the key skills we are looking for are:
The position and salary will be commensurate with the successful applicant’s skills. It will be at an ASO level, which is equivalent to the APS levels in the federal public service. Initially, we are looking for someone on a three to six month contract with the possibility of an extension.
Please visit www.icrc.act.gov.au for more information about the Commission or contact Jack on:
Phone - (02) 6205 8773
Email - jack.gregory@act.gov.au
We are currently looking for a recent grad to join the team at the Independent Competition and Regulatory Commission (the Commission):
The Commission is a statutory body set up to regulate prices, access to infrastructure services and other matters in relation to regulated industries (incl. water and electricity). Essentially, we are the economic regulator for the ACT.
Regarding the position, the key skills we are looking for are:
- A background in economics, the environment or public policy;
- A person with strong research and writing skills, capable of contributing discrete components to larger reports;
- A person with above average skills in MS Excel and Word; and,
- A person willing to learn on the job as well as possessing strong self-initiative and teamwork skills.
The position and salary will be commensurate with the successful applicant’s skills. It will be at an ASO level, which is equivalent to the APS levels in the federal public service. Initially, we are looking for someone on a three to six month contract with the possibility of an extension.
Please visit www.icrc.act.gov.au for more information about the Commission or contact Jack on:
Phone - (02) 6205 8773
Email - jack.gregory@act.gov.au
Subscribe to:
Posts (Atom)