Following up from Monday's post on SNIP2 and SJR2. I finally got a copy of the full database. 16866 journals have both a non-zero SNIP and a non-zero SJR for 2011. It's hard to understand how a journal could have a positive SJR but a zero SNIP, but there are a lot of such journals. There are a total of 32060 journals in the database. I plotted the two indicators for the subsample of journals against each other:
The relationship is pretty linear in log-log space except that SJR is truncated at 0.1. The correlation between the two series is 0.75 (0.77 for the log series).
There are 646 economics, econometrics, and finance journals that have a non-zero SNIP and SJR. Here is the scatterplot for the two indicators for this sample:
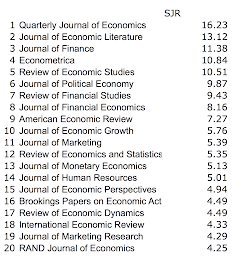
It looks very similar to the data for the full sample. So, it doesn't seem that there is a big difference between using one indicator or the other. Looking at the top 20 journals in economics and finance according to SJR, we have:
and looking at the top 20 according to SNIP we have:
The ranking by SJR does look a bit more intuitive I think. I'm thinking that long-term this is what we are going to be looking at using at the Crawford School once Elsevier have all the bugs out of the numbers :)


No comments:
Post a Comment