There are only a few days left to submit a paper to IAEE 2013. It overlaps with IEW 2013 so you can't got to both. I would love to visit Korea again though and the IAEE meeting in Perth last year was pretty good. But even if my abstract isn't accepted at IEW, I still want to go to Europe so I think I'll drop the idea of going to Korea.
Saturday, January 26, 2013
Friday, January 25, 2013
Sage Open Drops Publication Fee to $99
As part of what seems to be a race to the bottom in publication fees for gold open access journals, Sage Open announced that it is cutting its publication fee to $99.
Sage Open aims to be the PLoS One of the social sciences and humanites and covers all those disciplines. There don't seem to be any economics articles on there. Not surprising, as the working paper culture in economics makes open access far less important than in many other disciplines.
Sage Open aims to be the PLoS One of the social sciences and humanites and covers all those disciplines. There don't seem to be any economics articles on there. Not surprising, as the working paper culture in economics makes open access far less important than in many other disciplines.
Thursday, January 24, 2013
Total Radiative Forcing if Black Carbon Effect is Three Times Greater
Following up on a couple of recent posts. This is what anthropogenic, natural and total forcing look like if radiative forcing from black carbon is three times stronger than the RCP project assumed:

This seems to fit the observed temperature record better.

This seems to fit the observed temperature record better.
Wednesday, January 23, 2013
Monash-UMelb-ANU Economics Paper in Science
Paper by Lisa Cameron and Lata Gangadharan of Monash, Nisvan Erkal of U. Melbourne, and Xin Meng of ANU on the effects of the one child policy on social behavior in China. They used economic experiments and sophisticated econometrics to see the effects of the one-child policy on things like trust and risk-taking. This seems to be part of a trend to more regular articles in Science on social science topics.
Tuesday, January 22, 2013
Anthropogenic and Natural Forcing and Slowing Temperature Increase

The figure shows the total anthropogenic and natural radiative forcing and their sum. Anthropogenic forcing includes greenhouse gases and black carbon aerosols that have a warming effect and sulfate aerosols that have a cooling effect. Natural forcing is solar irradiance and sulfur aerosols emitted by large volcanic eruptions into the stratosphere. It is assumed that carbon dioxide, methane etc. are totally anthropogenic. This is of course not the case as atmospheric concentrations depend on the rate of removal of these gases and our results will show that the concentrations are endogenous. Based on these data anthropogenic forcing was very low until around 1970 after which it has increased monotonically. The forcing due to sulfur and black carbon aerosols is very uncertain. The estimated effect of sulfur is quite large here and that of black carbon is low compared to the most recent estimates. If sulfur has less cooling effect and black carbon more warming effect the increase in anthropogenic radiative forcing would be greater, especially in earlier years.
Natural forcings are dominated by large volcanic eruptions. In the last decade total forcing has been fairly constant due to a decline in natural forcing and something of slowing in the anthropogenic forcing. This might explain the relative hiatus in global temperature increase in this period (Hansen et al., 2013; Kaufmann et al., 2011). This chart shows global temperature and ocean heat content (upper 700m) over the same period:

But as the system has long lags, attributing changes in this way is probably more tempting than true.
Revised Estimates of Radiative Forcing Due To Black Carbon
A 232 page paper with 29 authors is in press at Journal of Geophysical Research-Atmospheres titled: "Bounding the role of black carbon in the climate system: A Scientific Assessment." The bottom line is that previous studies have underestimated the global warming effect (radiative forcing) of black carbon by about three times. With the authors' new much higher estimate it is second only to carbon dioxide in its positive contribution to radiative forcing. If this is true, I think it is good news as it means that the climate sensitivity due to greenhouse gases based on recent data is then probably less than previously thought. Projections from the RCP exercise, show black carbon emissions declining in the future.
The problem is that this effect is very uncertain both in terms of emissions and the radiative forcing effect. From p2 of the paper:
"Total global emissions of black carbon using bottom-up inventory methods are 7500Gg yr-1 in the year 2000 with an uncertainty range of 2000 to 29000. However, global atmospheric absorption attributable to black carbon is too low in many models, and should be increased by a factor of almost three. After this scaling, the best estimate for the industrial-era (1750 to 2005) direct radiative forcing of atmospheric black carbon is +0.71Wm-2 with 90% uncertainty bounds of (+0.08, +1.27) Wm-2."
A 95% confidence interval would stretch from roughly -0.04 to +1.38. In other words we can't reject the hypothesis that the effect is zero at the 5% significance level.
The lead author Tami Bond has a two page summary available.
Monday, January 21, 2013
Casuality between Energy and Output in the Long-Run
In my annual review post I promised to complete some papers in progress... so here is the second working paper for 2013. This is actually the revised version we are submitting after getting a revise and resubmit so the job was to revise rather than complete the paper. An earlier version of the paper is actually already online titled "From Correlation to Granger Causality". That was a version I prepared for a conference in 2011. This version is coauthored with Kerstin Enflo. Added to this version there are unit root tests with structural breaks and cointegration analysis using the Johansen procedure with and without structural breaks. Also all the test statistics have been recomputed and the discussion of Granger causality in general is reduced.
This is one of a couple of studies we are doing on energy-GDP causality. The other is a meta-analysis, the first paper of which will be coming soon. There is a huge literature on causality between energy use and economic output. There are literally hundreds of papers. Most studies use short time series, in which it is hard to come to strong conclusions about what is going on. And it would seem that a lot of the results are actually spurious as the true significance levels of the tests are much lower (i.e. bigger p value) than the researchers think. There are quite a few studies that use panel data - i.e. combine time series data for many countries - in order to get a bigger data set and higher statistical power. There is one published meta-analysis that combines the results of many studies and there is one published paper with a much longer time series. Our new paper also adopts the strategy of using a very long time series.
We use Swedish data from 1850 to 2000 on GDP, "gross output", capital, labor, energy, quality adjusted energy, energy prices, and oil prices. We show that Granger causality techniques are very sensitive to variable definition, choice of additional variables in the model, and sample periods. All of the following appear to make a finding that energy causes growth more likely: using multivariate models, defining variables to better reflect their theoretical definition, using larger samples, and including appropriate structural breaks. We find causality from energy to GDP using a multivariate model for the full sample period. But in data for just the last 50 years this finding is reversed.
It is possible that the relationship between energy and growth has changed over time. On the other hand, it seems likely to me that causality in fact runs both ways, but what is actually detected depends on the size of the shocks to the two variables in the sample observed. One thing that has changed is that the cost share of energy has declined over time. This means that the output elasticity of energy has declined and we would expect the effect of changes in energy use to, therefore, have less impact on output. These smaller effects are harder to detect especially as the sample size gets smaller and reduces statistical power. On the other hand, the effect of output on energy use shouldn't have declined.
The paradox of the energy-GDP relationship is that the more important that energy is in terms of being essential in production the less the quantity of energy used will change in response to price shocks. However, the inability to substitute for energy will cause demand for other inputs and goods and services to decline by more. So energy prices can have a bigger effect on the economy but the quantity of energy to GDP relationship is weaker. We do find that energy prices have a significant causal impact on both energy use and output both in the longer and shorter (more recent) sample.
Another finding is that allowing for structural breaks reduces the signfiicance level of the Toda-Yamamoto Granger causality tests but makes it easier to find cointegration in our VAR models. This is paradoxical as cointegration implies that there must be Granger causality in at least one direction.
Sunday, January 20, 2013
Upcoming Conference Deadlines

I just submitted papers to EAERE 2013, which is in Toulouse and the International Energy Workshop, which is in Paris. Both in June. The deadline for both is 1st February. EAERE requires presenters to submit a full paper, while IEW says your chances of getting accepted are better if you do.

Friday, January 18, 2013
Historic High Temperature in Sydney Today
Temperature at Observatory Hill hit 45.8C at 2:55pm today. Previous record was from 1939. I remember my mother telling me how hot it was in the late 1930s in Sydney. She was 7 years old then. My father remembered the German hyperinflation when he was the same age. Seems like these events made similar impressions.
 Temperature records at Observatory Hill date to 1859. It hit 41.6C in Canberra which is close to but not a record. Nowra also had a new record high.


Saturday, January 12, 2013
Genes as Instrumental Variables

When we got home I did some research. A full genome sequence still costs close to $10k. There is some research along these lines out there. It seems that besides cost the biggest issue is the low correlation between any given gene and given phenotypes. Such instruments would be weak. So it seems that multiple indicators and or factor analysis is needed. But if these issues are overcome and the cost comes down further, I can see that this will be become a huge area in many areas of economics including health and education obviously.

Friday, January 11, 2013
ANU is Number One in the World...
On mean kilometres between collaborators on papers! On average our collaborators are 4,522km from us:

This is just one the rankings you can get from the Leiden Ranking of universities. They aim to be more transparent than other well-known rankings like the Shanghai Jiaotong or QS rankings. Another very interesting feature are confidence intervals obtained by boot-strapping.
ANU does not rank very well by more conventional measures of impact. The authors preferred ranking is by the PP top 10% indicator. This is the percentage of a university's publications that are in the top 10% most cited publications. It's not source normalized, however, so universities with strong biomedical research efforts will rank higher. ANU is ranked only 114th with 12.9%. But note that even the top school - MIT - only scores 25.2%. So there is not much variation across most of the 500 research universities.
Another ranking is by source normalized impact factor. This should take into account the differences between disciplines. ANU ranks 118th with an impact of 1.21. MIT has an impact of 2.17. So there is again little variation. Much less variation than among journals which have less variation than individual researchers, which have less variation than articles. I'm actually surprised how little variation there is across universities. Of course, all these are research oriented universities, but still.
Something missing from these ranking is the average number of articles per researcher. It's not possible to work this out from the Web Science in any accurate way. Based on the RePEc rankings Australian economists publish above average numbers of papers given their RePEc rank, but these are cited less. I suspect because of the distance of Australia from elsewhere, despite our high levels of international collaboration.
First International Workshop on Econometric Applications in Climatology

It is interesting that there is enough activity in this space to hold a conference. It has definitely been attracting more and more attention. We - Robert Kaufmann and I - were pioneers in this area starting with our paper in Nature in 1997. Despite the relative success of this first paper I didn't find it an easy field to make much headway in and gave up on that line of inquiry around 2005-6. Robert persevered with some success. I now actually have a new paper in preparation. I hoep to get round to finishing it later this month. Maybe I should submit it to this conference?
Uncertainty Measures for Economics Journal Impact Factors
I have a new working paper out - Uncertainty Measures for Economics Journal Impact Factors. A version of the paper will appear in the March issue of the Journal of Economic Literature together with a couple of other papers on publishing in economics - one by Daniel Hamermesh and the other by Stefano Della Vigna and David Card. Some of the most recent literature review was posted here. I first blogged on this topic early last year starting with calculating the confidence interval for the Journal of Economic Growth's two year impact factor. In the end I did this for all economics journals that had a five year impact factor in the Journal Citations Reports. All 230 of them. The following graph shows the confidence intervals:
 I used a stock price chart in Excel to generate this graph! As you can see, the top two journals - Journal of Economic Literature (JEL) and Quarterly Journal of Economics (QJE) - are in a distinct class on their own. There is also a tail of a few very weak journals. I wonder why these are included in the Web of Science which deliberately only includes journals with decent citation rates. For the vast majority of journals it is hard to tell what rank they should have given the impact factor for a single year anyway. Certainly, small changes in rank from year to year which journals like to publicize when they increase have little meaning. Journals with very wide confidence intervals are those that publish few articles or have very skewed citations. In particular, the Journal of Experimental Economics ranked 23rd had one star article with far more citations than any other in the journal. It still has a respectable impact factor (1.8) without that article.
Another way of presenting the data is in terms of the range of ranks that could be ascribed to each journal:

For this graph I used the secret method for producing box plots in Excel.The shaded boxes is the continuous range of ranks that are are not statistically significantly different to the estimated rank (black dot) at the 95% confidence level. The whiskers indicate the most extreme outlying journals that have statistically insignificantly different ranks. The graph only shows the analysis for a subsample of 30 journals, though I compared each of these journals against all 229 other journals to derive the box plot. It's clear from this how much uncertainty there is over the exact ranks of most journals. The impact factor is the mean number of citations each article published in the journal got. Instead we can look at the median:
Another way of presenting the data is in terms of the range of ranks that could be ascribed to each journal:
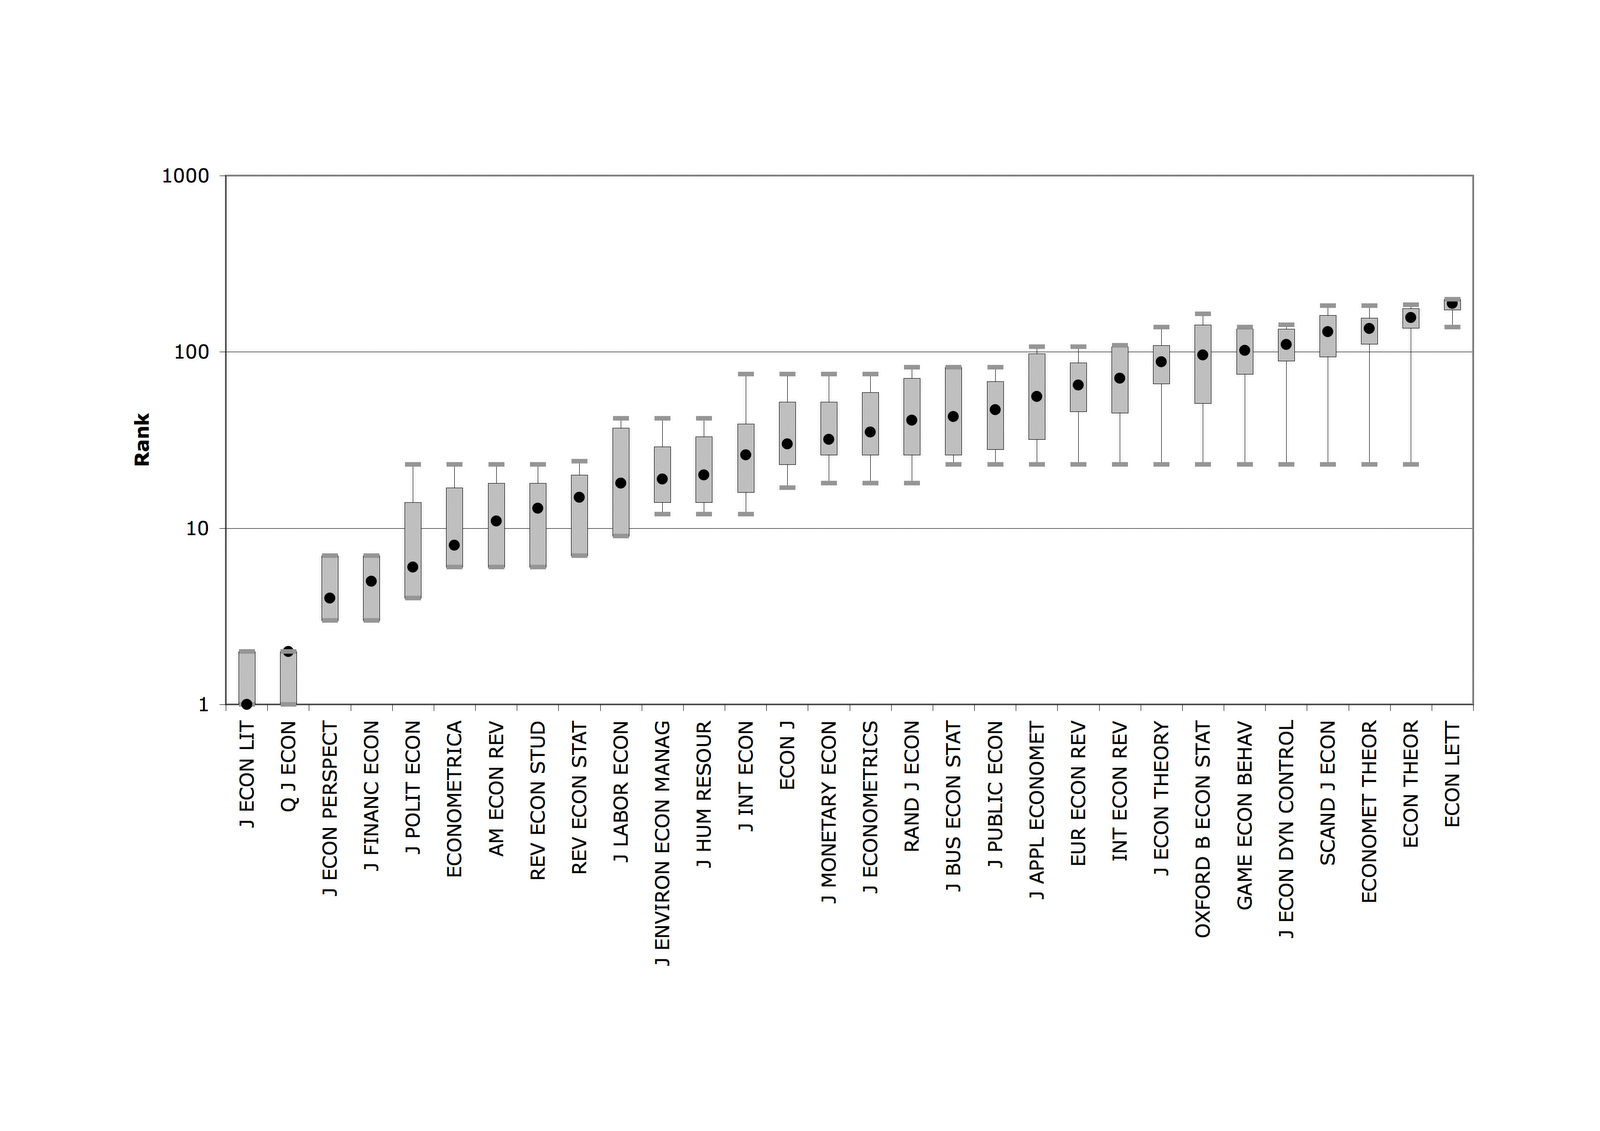

Does this mean that impact factors are meaningless? I don't think so, but don't sweat small differences in impact factors when deciding where to submit your next academic paper.
Signs of Fracking

For more around a decade methane concentrations in the atmosphere were pretty much constant from year to year. In the last few years they have begun to creep up again Is that the sign of the fracking boom? Some research finds that methane leakage from fracking is much greater than from traditional gas fields and supply networks. We estimated that gas supply was the smallest anthropogenic source and gas flaring had declined from its peak contribution:

Flaring might also be again increasing. Climate Progress posted this image of gas flaring in North Dakota:

Friday, January 4, 2013
World Scientific Output
From Information Processing - Number of scientific papers in 2012 and proportion of highly cited ones.

Australia (population = 23 million) has a decent showing with roughly double the output of Sweden (9.5 million) in terms of total papers and highly cited ones and half the output of the UK (63 million).

Australia (population = 23 million) has a decent showing with roughly double the output of Sweden (9.5 million) in terms of total papers and highly cited ones and half the output of the UK (63 million).
Thursday, January 3, 2013
Other Emissions of Greenhouse Gases and Aerosols
I only cover three other types of emissions besides energy related CO2. I thought of including black carbon but in the end decided to skip it as I already have too many papers. I resisted the temptation to try to include two of my papers in the collection, though I ended up discussing my paper more below :) I also include a graphic that will not be appearing in our book. It is from Smith et al. (2011) and compares the various estimates of sulfur emissions.
Deforestation and land-use change is an important source of emissions of CO2. Levels of emissions are much lower than from energy related sources, more stable over time, but also very uncertain. Houghton (2003) presents estimates of CO2 emissions from land-use change from 1850 to 2000, globally and by region. In general the tend rises from 1 to 2 Gt C over the 150 years with an acceleration in the trend around 1950 in common with emissions from energy related sources. Therefore, there is a clear link with economic growth. Tropical deforestation, particularly in Asia and Latin America dominates. In recent decades there is net reforestation in developed countries. Unusually, the data are increasingly uncertain in recent decades with estimates from different researchers varying substantially (Houghton, 2010).
The third most important greenhouse gas in the atmosphere and the second most important anthropogenic source is methane. Relatively little work has been done on CH4 in comparison to CO2. Stern and Kaufmann (1996) used available data to reconstruct the first time series of historic emissions from 1860-1993. They found that anthropogenic emissions had increased from 80 million tonnes of carbon in 1860 to 380 million in 1990. The relative importance of the various emissions sources changed over time though rice farming and livestock husbandry remained the two most important sources.
Offsetting the radiative forcing due to greenhouse gases is a significant negative forcing due to aerosols derived from sulphur oxide (primarily dioxide) emissions. These aerosols do not persist in the atmosphere for usually more than a few days and so the source of emissions is important and effects are localized though they spread far beyond the sources to affect neighbouring countries. The main sources of anthropogenic sulphur emissions are the combustion of coal and metal smelting. Stern (2006) showed that that after increasing fairly steadily from 1850 to the early 1990s global emissions began to trend downwards. Emissions in Western Europe and North America as well as Japan had already been trending down since 1970 primarily due to policies to reduce acid rain (Stern, 2005). But this decline was offset by growth in other regions. Following 1990, there was a dramatic reduction in emissions from Eastern Europe and the former Soviet Union. The likelihood that emissions will continue to decline in the future will contribute to future warming. Whereas Stern (2006) uses a combination of previously published data and model estimates, Smith et al. (2011) provide an inventory of sulphur emissions from 1850 to 2005 using a uniform methodology. The results largely confirm Stern’s (2006) findings though the levels are generally lower by a few percent.

References
Houghton, R. A. (2003) Revised estimates of the annual net flux of carbon to the atmosphere from changes in land use and land management 1850-2000, Tellus 55B: 378-390.
Houghton, R. A. (2010) How well do we know the flux of CO2 from land use change? Tellus 62B: 337-351.
Smith, S. J., J. van Ardenne, Z. Klimont, R. J. Andres, A. Volke, S. D. Arias (2011) Anthropogenic sulfur dioxide emissions: 1850-2005, Atmospheric Chemistry and Physics 11: 1101-1116.
Stern D. I. (2005) Beyond the environmental Kuznets curve: Diffusion of sulfur-emissions-abating technology, Journal of Environment and Development 14(1), 101-124.
Stern D. I. (2006) Reversal in the trend of global anthropogenic sulfur emissions, Global Environmental Change 16(2), 207-220.
Stern D. I. and R. K. Kaufmann (1996) Estimates of global anthropogenic methane emissions 1860-1993, Chemosphere 33, 159-176.
Rogelj et al. Mitigation Paper in Nature
The latest issue of Nature has a paper on climate mitigation by Rogelj et al. The issue also has a "News and Views" item by Steve Hatfield Dodds on the paper. The paper has an interesting message*: Delay in acting on mitigation has the biggest effect on the probability of achieving the 2C target, carbon taxes above $20-40 per tonne have little effect on mitigation, and carbon capture and storage (CCS) is essential. This is a message that environmentalists, business, and fossil fuel producers will like. As Steve points out, one weakness of the paper is that it is all done with the MESSAGE integrated assessment model and that is kind of a black box. In the EMF-22 modelling exercise, MESSAGE had some of the lowest carbon taxes. For a 450 ppm scenario its 2020 carbon tax was only $15. By contrast, FUND had a $260 carbon tax. So MESSAGE is an optimistic model. Other models definitely don't have this carbon tax saturation phenomenon as can be seen from our meta-analysis.
Our PhD student Hyung-Sup Lee's PhD thesis will provide a similar kind of uncertainty analysis purely on the economic side of things using that EMF-22 data.
* Pun kind of intended :)
Our PhD student Hyung-Sup Lee's PhD thesis will provide a similar kind of uncertainty analysis purely on the economic side of things using that EMF-22 data.
* Pun kind of intended :)
Wednesday, January 2, 2013
Decomposing Emissions
Latest installment.
The Kaya identity decomposes total energy-related emissions into the product of population, income per capita, energy intensity, and carbon intensity of energy carriers (Kaya, 1997). It is an extension of the IPAT identity (Ehrlich and Holdren, 1971) that decomposes its technology factor into two more factors. It is important to understand that this framework is an accounting identity and not a causal model. For example, growth in income per capita might drive or be associated with reduced energy intensity so that the factors are not independent.
Raupach et al. (2007) is a highly cited example of this literature. They show that global emissions growth since 2000 was driven by a cessation or reversal of earlier declining trends in the energy intensity of gross domestic product (GDP) (energy/GDP) and the carbon intensity of energy (emissions/energy), coupled with continuing increases in population and per-capita GDP. Nearly constant or slightly increasing trends in the carbon intensity of energy were observed in both developed and developing regions and no region was significantly decarbonizing its energy supply. The growth rate in emissions was strongest in rapidly developing economies, particularly China. This research group also published another highly cited paper in 2007 linking emissions growth and its drivers to the atmospheric concentration of carbon dioxide (Canadell et al., 2007).
Many papers examine the role of particular Kaya factors in explaining historical emissions and driving future projections. The most important factor driving declining energy intensity and to some degree carbon intensity is technological change. Grübler et al. (1999) present a framework for energy technology analysis and discuss methods that can be used to analyze the impact of technological changes on global warming. In the historical record, they identify characteristic “learning rates" for the reduction in cost of energy technologies that allow simple quantified characterization of the improvement in cost and performance due to cumulative experience and investments. They also identify patterns, processes and timescales that typify the diffusion of new technologies in competitive markets. Technologies that are long-lived and are components of interlocking networks typically require the longest time to diffuse and co-evolve with other technologies in the network; such network effects yield high barriers to entry even for superior competitors. The authors show how it is possible to include learning phenomena in micro- and macro-scale models. Doing so can yield projections with lessened environmental impacts without necessarily incurring a negative effect on the economy.
The authors also address the final Kaya factor – carbon intensity of energy. They show that over time the fuels that power the economy have had progressively more energy per unit of carbon pollution - from coal to oil to gas. Such replacement has historically “decarbonized'' the global primary energy supply 0.3% per year.
Besides technological change another potential driver of declining energy intensity is structural change of economy towards a service oriented economy. It is usually thought that such an economy will have lower energy intensity and, therefore, emissions intensity of income. Henriques and Kander (2010) argue that this interpretation is overly optimistic because the shift to a service economy is somewhat of an illusion in terms of real production. The share of an industry in the economy is a function of both the real level of production and the price of output. The share of the manufacturing sector has declined in developed countries because rapid productivity gains have reduced its output price relative to the service sector. When constant prices are used, less of a shift to a service economy is seen. The main driver of the decline in energy intensity in developed countries is, therefore, productivity gains in manufacturing. For emerging economies like Brazil, Mexico and India, it is the residential sector that drives energy intensity down because of the declining share of this sector as the formal economy grows, and as a consequence of switching to more efficient fuels.
Another important issue related to the decomposition literature is to what degree trade and foreign investment have allowed developed countries to reduce their apparent energy intensity. Since the early days of the environmental Kuznets curve literature this was seen as a potential explanation of reduced pollution in developed economies (Stern et al., 1996). Most mainstream economists (Levinson, 2010) and economic historians (e.g. Kander and Lindmark 2006) have argued that the role of trade. Peters and Hertwich (2008), however, find that most developed countries were net importers of embodied carbon dioxide emissions in 2001 – in other words, their imports required more emissions to produce than their exports did. For the United States the difference amounted to 120 Mt C while for the UK it was 28 Mt. But this does not imply that if they produced all these products at home their net emissions would be this much higher. This is because production in developing countries is much more energy intensive than in developed countries when measured at market exchange rates and some developed countries, in particular China and India are particularly carbon intensive. This explains the differences on this issue between economists and researchers from engineering backgrounds.
A little researched topic is what happens to the Kaya factors in the short-run over the course of the business cycle. In a response to Peters et al. (2012), Jotzo et al. (2012) hint that the rate of change in energy intensity follows a strong cycle with the rate of decline slowing in the aftermath of recessions and increasing later in the business cycle. Alternatively, emissions could be seen as responding asymmetrically to increases and decreases in income (York, 2012).
References
Canadell, J. G., C. Le Quéré, M. R. Raupach, C. B. Field, E. T. Buitenhuis, P. Ciais, T. J. Conway, N. P. Gillett, R. A. Houghton, and G. Marland (2007) Contributions to accelerating atmospheric CO2 growth from economic activity, carbon intensity, and efficiency of natural sinks, Proceedings of the National Academy of Sciences 104(47): 18866–18870.
Ehrlich, P. R. and J. P. Holdren (1971) Impact of population growth, Science 171(3977): 1212-1217.
Grübler, Arnulf, Nebojsa Nakicénovic, and David G. Victor (1999) Dynamics of energy technologies and global change, Energy Policy 27: 247-280.
Henriques, Sofia Teives, and Astrid Kander (2010) The modest environmental relief resulting from the transition to a service economy, Ecological Economics 70(2): 271-282.
Jotzo F., P. J. Burke, P. J. Wood, A. Macintosh, and D. I. Stern (2012) Decomposing the 2010 global carbon dioxide emissions rebound, Nature Climate Change 2(4): 213-214.
Kander, Astrid and Lindmark, Magnus, 2006. "Foreign trade and declining pollution in Sweden: a decomposition analysis of long-term structural and technological effects," Energy Policy, Elsevier, vol. 34(13), pages 1590-1599, September.
Kaya, Y. and K. Yokobori (1997) Environment, Energy, and Economy: Strategies for Sustainability, United Nations University Press.
Levinson, A. (2010) Offshoring Pollution: Is the United States Increasingly Importing Polluting Goods? Review of Environmental Economics and Policy 4(1): 63-83.
Peters, Glen P. and Edgar G. Hertwich (2008) CO2 Embodied in International Trade with Implications for Global Climate Policy, Environmental Science and Technology 42(5): 1401-1407.
Peters, Glen P., Gregg Marland, Corinne Le Quéré, Thomas Boden, Josep G. Canadell & Michael R. Raupach (2012) Rapid growth in CO2 emissions after the 2008–2009 global financial crisis, Nature Climate Change 2, 2–4.
Raupach, Michael R., Gregg Marland, Philippe Ciais, Corinne Le Quéré, Josep G. Canadell, Gernot Klepper, Christopher B. Field (2007) Global and regional drivers of accelerating CO2 emissions, Proceedings of the National Academy of Sciences 104(24): 10288-10293.
Stern D. I., M. S. Common, and E. B. Barbier (1996) Economic growth and environmental degradation: the environmental Kuznets curve and sustainable development, World Development 24, 1151-1160.
York, R. (2012) Asymmetric effects of economic growth and decline on CO2 emissions, Nature Climate Change 2(11): 762-764.
Tuesday, January 1, 2013
Carbon Emissions, The Environmental Kuznets Curve, and Convergence
I'm going to include one paper on the EKC and one on convergence.
The most popular approaches to explaining historical emissions are the environmental Kuznets curve and the decomposition approach using the Kaya identity. These approaches can also be used to produce simple projections of future emissions given information on the relevant drivers.
The environmental Kuznets curve hypothesis proposes that concentrations or per capita emissions of various pollutants rise and then fall as per capita income increases. Static and dynamic theoretical models are given by Plassmann and Khanna (2006) and Brock and Taylor (2010) respectively, while Carson (2010) provides a recent survey. For carbon dioxide the relevant variable is emissions per capita. Following the original paper on the topic by Grossman and Krueger (1991), the World Bank published an issue of the World Development Report timed for the Rio de Janeiro Earth Summit in 1992 that featured an environmental Kuznets curve for carbon dioxide among various environmental indicators. The econometric estimates showed that per capita carbon emissions rise monotonically with per capita income within the observed range (Shafik, 1994). This result was confirmed by Holtz-Eakin and Selden (1995), which is the classic paper on the carbon EKC. They found also found a monotonic relationship between income per capita and CO2 emissions though the propensity to emit with income declines. Recent papers by Wagner (2008), Vollebergh et al. (2009) and Stern (2010) that use different econometric methods do not substantially change the conclusions despite some intervening papers (e.g. Schmalensee et al. 1998) that claimed that there was an inverted U shaped curve for CO2 with an in sample peak. This is also a paper that has stood the test of time in terms of projected emissions to date, though future projected emissions are lower than Edmonds and Reilly (1983) or RCP 8.5.
A related literature looks at whether per capita emissions are converging over time across countries. If there is convergence in GDP per capita then if the income emissions relation is monotonic there should also be convergence in emissions, at least conditionally. Strazicich and List (2003) examined the time paths of carbon dioxide emissions in twenty-one industrial countries from 1960–1997 to test for stochastic and conditional convergence. They performed estimated both panel unit root tests and cross-section regressions. Overall, they found significant evidence that CO2 emissions have converged. Subsequent research has tested whether this result holds across both developed and developing countries with mixed results (e.g. Aldy, 2006; Westerlund and Basher, 2008; Brock and Taylor, 2010).
References
Aldy, Joseph E. (2006) Per capita carbon dioxide emissions: convergence or divergence? Environmental and Resource Economics 33(4): 533-555.
Brock, William A. and M. Scott Taylor (2010) The green Solow model, Journal of Economic Growth 15:127–153.
Carson, R. T. (2010) The environmental Kuznets curve: Seeking empirical regularity and theoretical structure, Review of Environmental Economics and Policy 4(1): 3-23.
Edmonds, Jae and John Reilly (1983) Global energy and CO2 to the year 2050, The Energy Journal 4(3): 21-48.
Grossman, G. M. and A. B. Krueger (1991) Environmental impacts of a North American Free Trade Agreement, National Bureau of Economic Research Working Paper 3914, NBER, Cambridge MA.
Holtz-Eakin, Douglas and Thomas M. Selden (1995) Stoking the fires? CO2 emissions and economic growth, Journal of Public Economics 57(1): 85-101.
Plassmann, Florenz and Neha Khanna (2006) Preferences, Technology, and the Environment: Understanding the Environmental Kuznets Curve Hypothesis, Amer. J. Agr. Econ. 88(3) (August 2006): 632–643.
Schmalensee, R., T. M. Stoker and R. A. Judson (1998), ‘World Carbon Dioxide Emissions: 1950-2050’, Review of Economics and Statistics, 80, 15-27.
Shafik N., Economic development and environmental quality: an econometric analysis, Oxford Economic Papers 46, 757-773 (1994).
Stern D. I. (2010) Between estimates of the emissions-income elasticity, Ecological Economics 69, 2173-2182.
Strazicich, Mark C. and John A. List (2003) Are CO2 emission levels converging among industrial countries? Environmental and Resource Economics 24(3): 263-271.
Vollebergh, Herman R.J., Bertrand Melenberg, and Elbert Dijkgraaf (2009) Identifying reduced-form relations with panel data: The case of pollution and income, Journal of Environmental Economics and Management 58(1): 27-42.
Wagner, M., 2008. The carbon Kuznets curve: A cloudy picture emitted by bad econometrics. Resource and Energy Economics 30, 388-408.
Westerlund, Joakim and Syed A. Basher (2008) Testing for convergence in carbon dioxide emissions using a century of panel data, Environmental and Resource Economics 40:109–120.
Most Popular Posts 2012
These are the most popular new posts in 2012. In general my readers are interested in journal rankings and impact and jobs but also some other topics. These numbers are based on my Google Analytics reports. The stats that Google now provides within Blogger would give a somewhat different hit list.
1. PLOS One's 2011 Impact Factor. PLoS ONE is the world's biggest journal and so a lot of people are interested in its impact factor. A lot of the hits on my blog are PLoS ONE related.
2. In Defence of Elsevier. Being controversial helps hits :)
3. Several Crawford Jobs Available. I posted the link on RESECON and got lots of hits.
4. The Rise and Fall of Ecological Economics. This is more of a surprise in terms of number of hits.
5. Scientific Collaboration Networks. These maps are cool.
6. 2011 Journal Citation Report Released. More journal rankings.
7. Acceptance Rates in the Top Environmental Economics Journals. More on getting published, or not.
8. Google Scholar Metrics. Another way to rank journals.
9. Calculating an Individual Impact Factor Using Scopus. A way to compare individual researchers to journals. And it is pretty easy to do.
10. The Inside Story on the 2010 ERA Economics Journals Rankings. Yet more on journal rankings.
Subscribe to:
Posts (Atom)